Quick Start
Start working fast with key functionality.
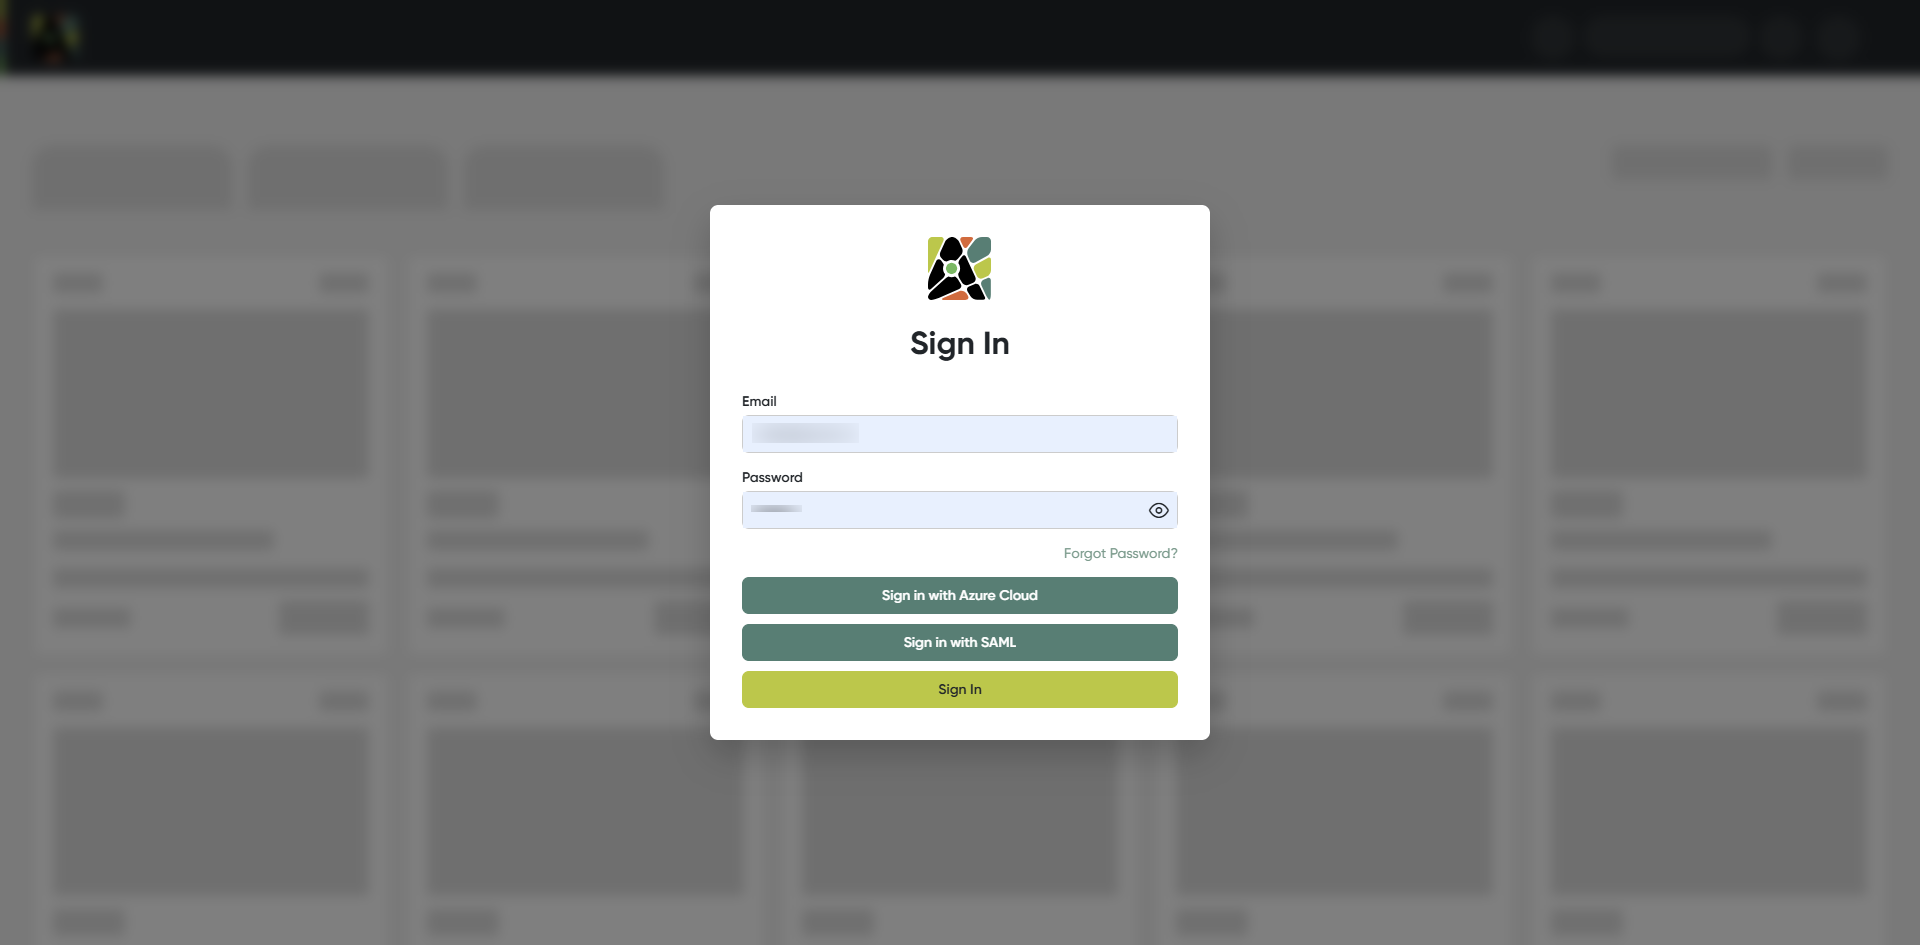
1. Login
Login to the Analytics Hub.
- Enter email
- Enter password
Also, you can sign in with your Azure Cloud account
Please note:
- Upon first login, the user must change their password.
- One year after the last password change, the password becomes invalid, and the user is required to update it.
2. Home Page
On the Home page you can find:
-
Your Personal Dashboard to access the most frequently used reports
-
Picked for me - displays all objects belonging to the categories you're subscribed to and additionally shows reports to which you gained access in the last 30 days.
Please note Only objects created after you subscribed to a category will appear in the 'Picked for Me' section. Newly added objects within your subscribed categories will be visible there for 30 days.
When a new object appears in this tab, a green activity indicator is shown on the tab. The indicator disappears once you open 'Picked for me' and then move to another tab, page, or refresh.
-
My Categories - displays all categories you’ve pinned. To view all available categories, open the My Categories tab and click Show all - This button opens the page with all categories, where you can view or edit them depending on your license.
-
Navigation menu with four modules:
-
Business Glossary
-
Report Catalogue
-
Helpdesk
-
Technical Assets
-
-
Quick search - helps you find objects pinned to your Personal Dashboard.
-
Show all objects – displays notifications about mentions in object comments and business processes in which you are involved.
-
Global Search
-
My Workspace – your individual workspace where you can add and locate objects easily
-
Notifications center - here you can find mentions in comments to objects and business processes where you involved.
-
User Menu
- Profile settings
- Accton Auditor
- My Workspace
- Admin panel
- Requests
- Help Request
- Help Center
- Log out
If you have any questions or encounter issues, open the User Menu and select:
-
Help Request - submit queries about bugs, issues, product ideas, improvements, or any other concerns
-
Help Center - explore resources such as the User Guide, Technical Documentation, and API Specifications for detailed assistance
-
All reports - opens the Report Catalogue by default. This button can also be configured to open a custom link.
-
My Accessible Reports - displays all BI reports that you have permission to access.
-
Create - this button allows you to create objects, categories, and object requests.
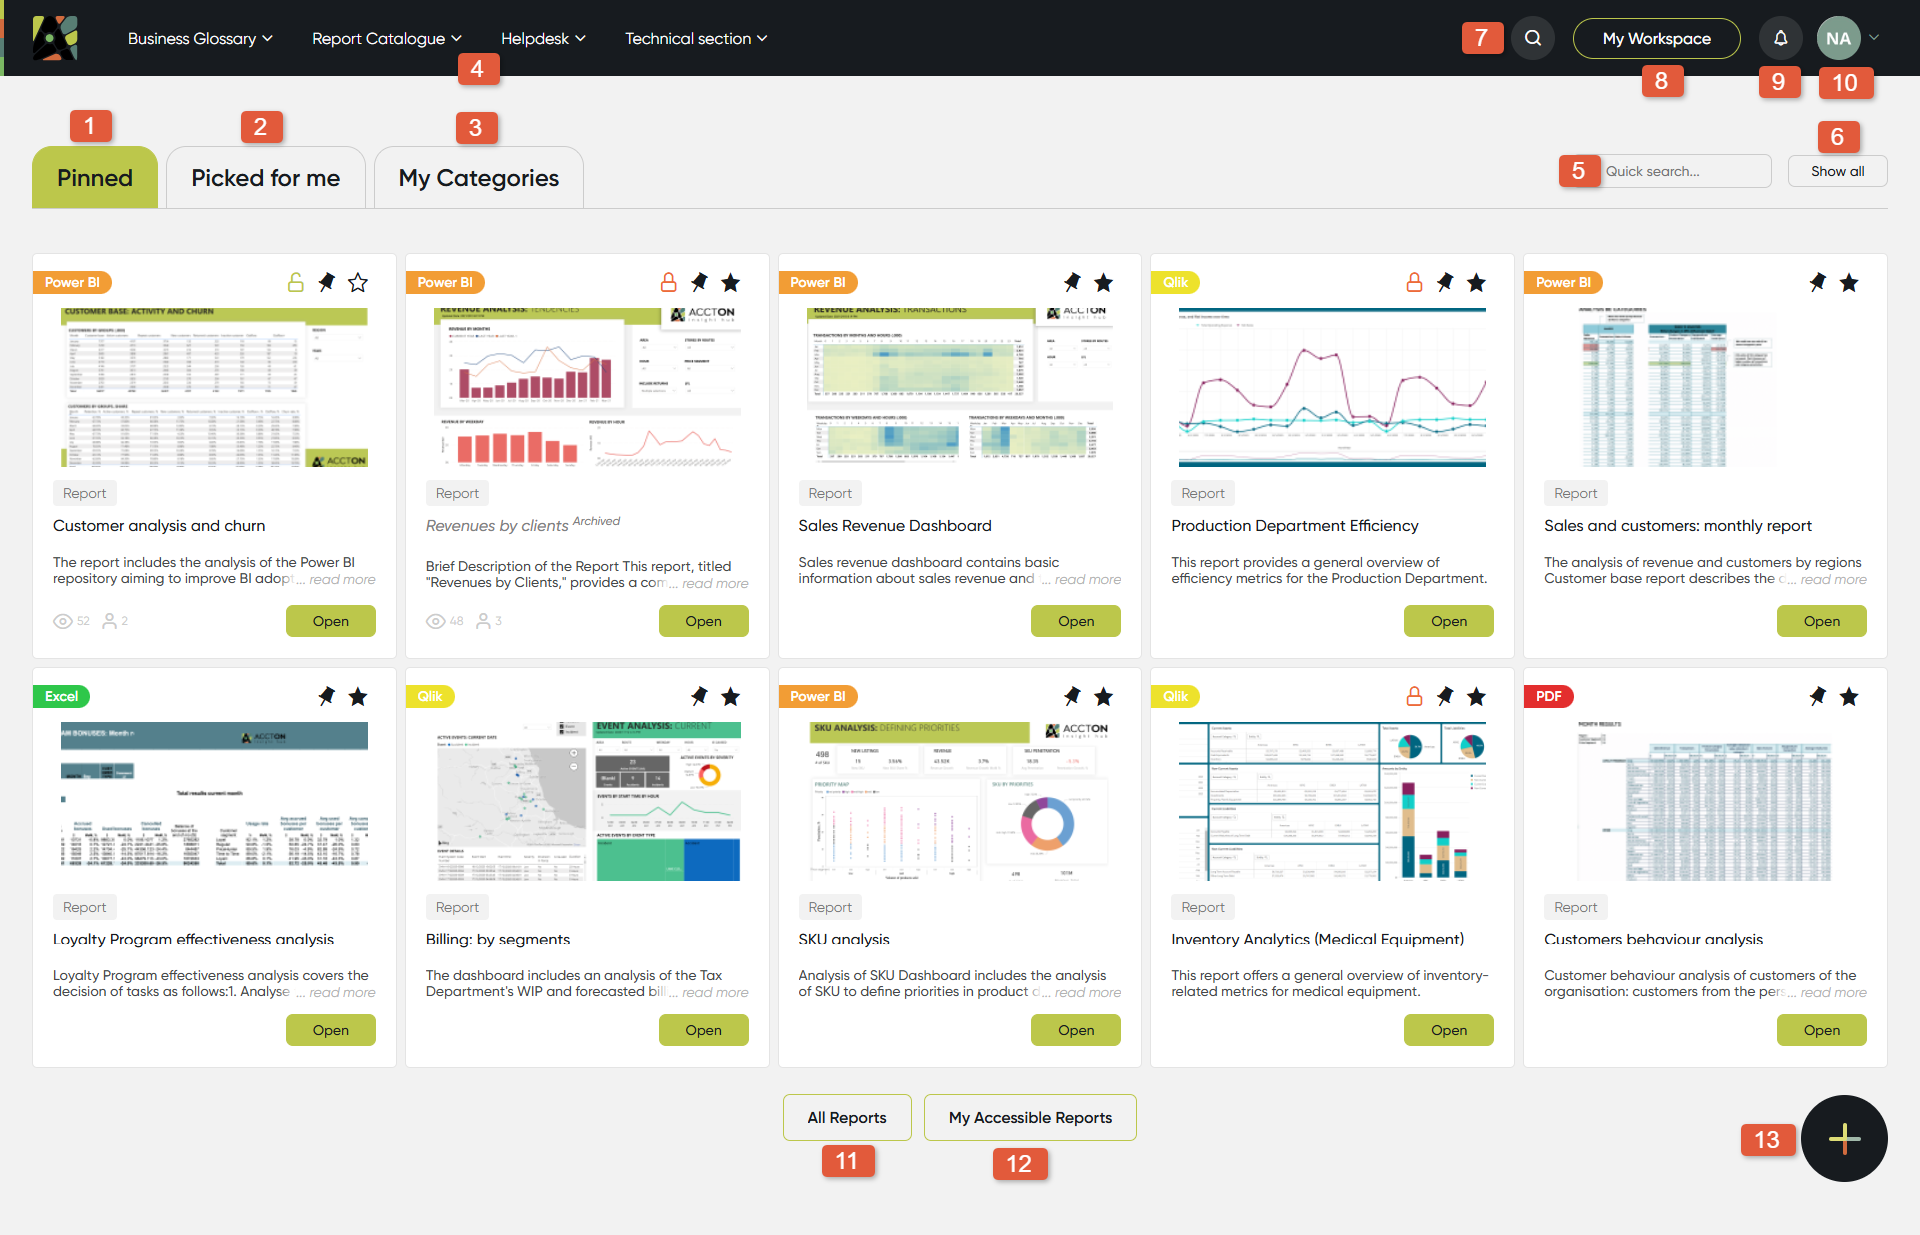
3. My Dashboard
Convenient access of your most used items.
Place your most important reports here and easily access them by clicking the “open” button (b).
Click on logo (a) to return to the homepage from anywhere to see your pinned reports.
Easily access reports by clicking the Open button (b).
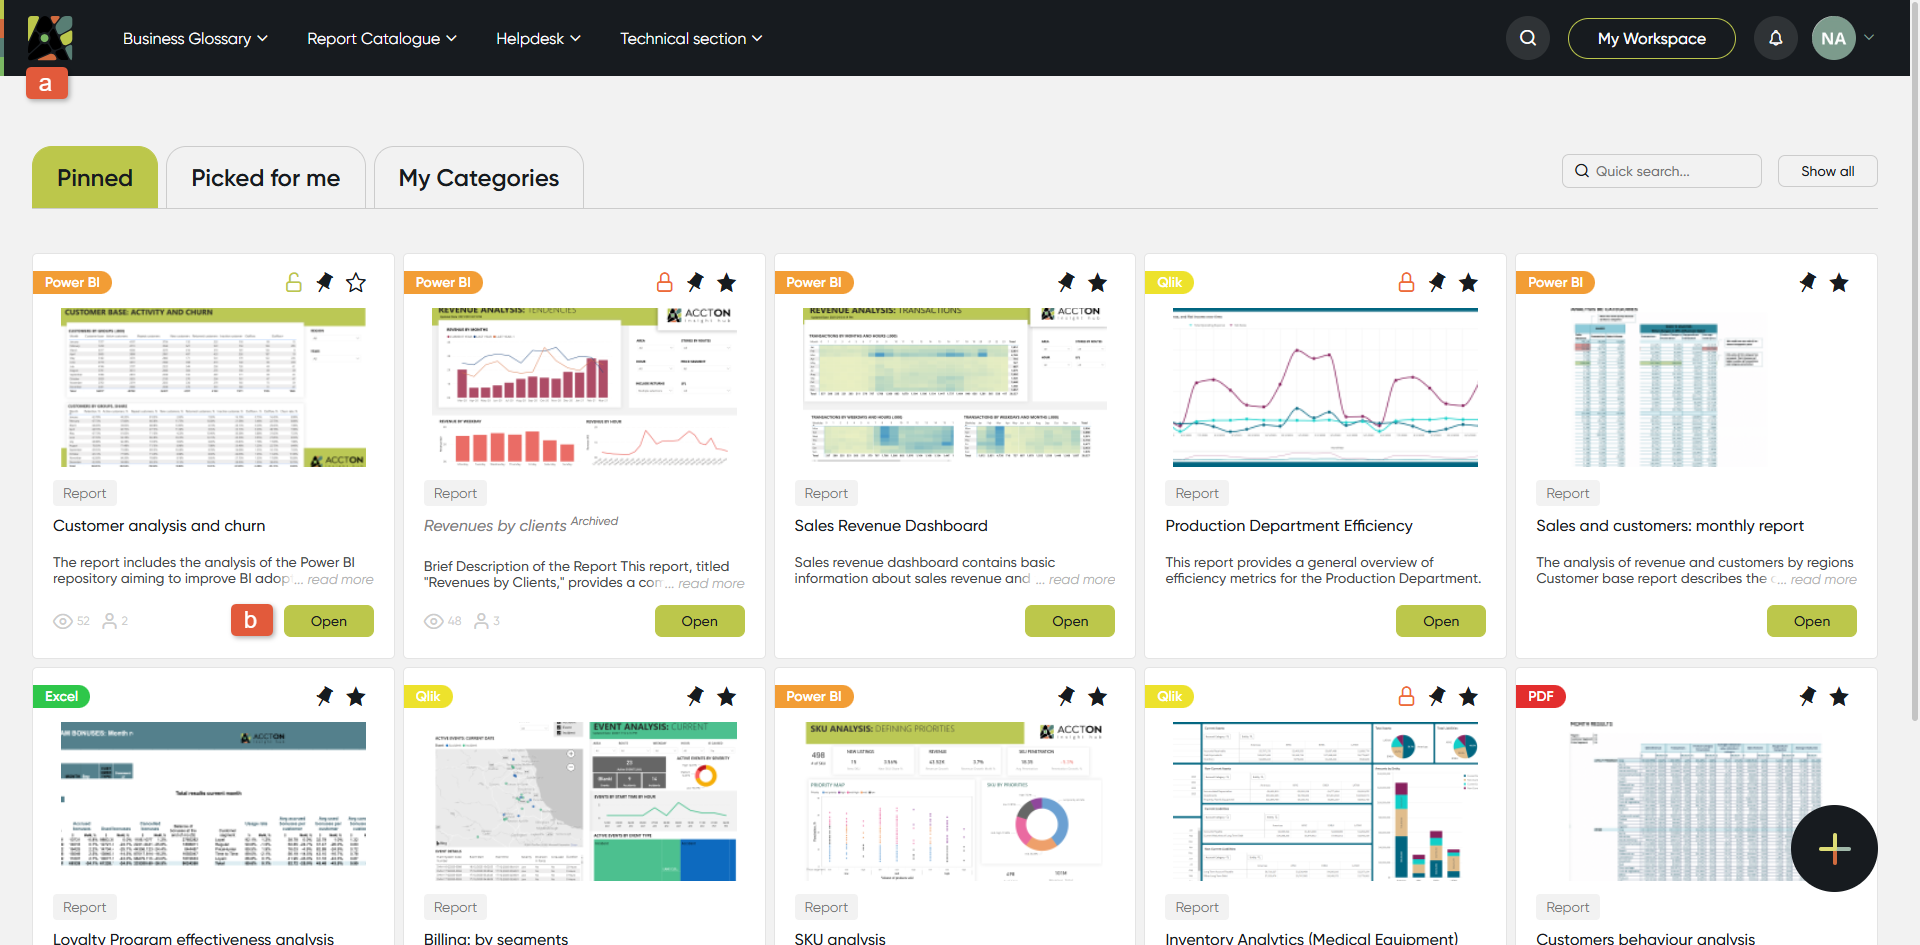
4. Navigation Menu - Modules
You can navigate through three main modules in the top menu:
(a) Business Glossary - information structured by Functions and Business areas. If you know the Business area you are looking for, click on it. You can also see the list of object types
(b) Report Catalogue - reports of the organisation structured by different areas; You can also see the list of BI systems
(c) Helpdesk - find guides, policies, and related documents
(d) Technical Section - access technical objects
Click on the module page to view and filter all objects related to it.
Module 1. Business Glossary
In the Business Glossary module you can find:
(a) filtering panel – with the help of the filtering panel you can quickly find what you need, i.e. select object type first, then check other filters.
(b) module checkbox – on each page of the module, users can see a checkbox under the module name. Using this checkbox, you can select all filtered objects. After selection, users can either delete them or move them to another category. The number of selected objects is displayed in red text.
(c) all related objects – indicators, dimensions, business terms, etc.
The filter panel allows you to find objects based on their statuses within the business processes they are part of. In fact, in all modules, users can filter content using available filters. Special filters include status filters and archived object filters, which allow you to view only active, archived, or specific-status items.
For more detailed information, please refer to the Filters page.
(d) object card checkbox – on each page of the module, users can see a checkbox on individual object cards. Selecting a single card enables the functions to copy, move to another category, or delete the selected object. If more than one card is selected, the copy function becomes unavailable.
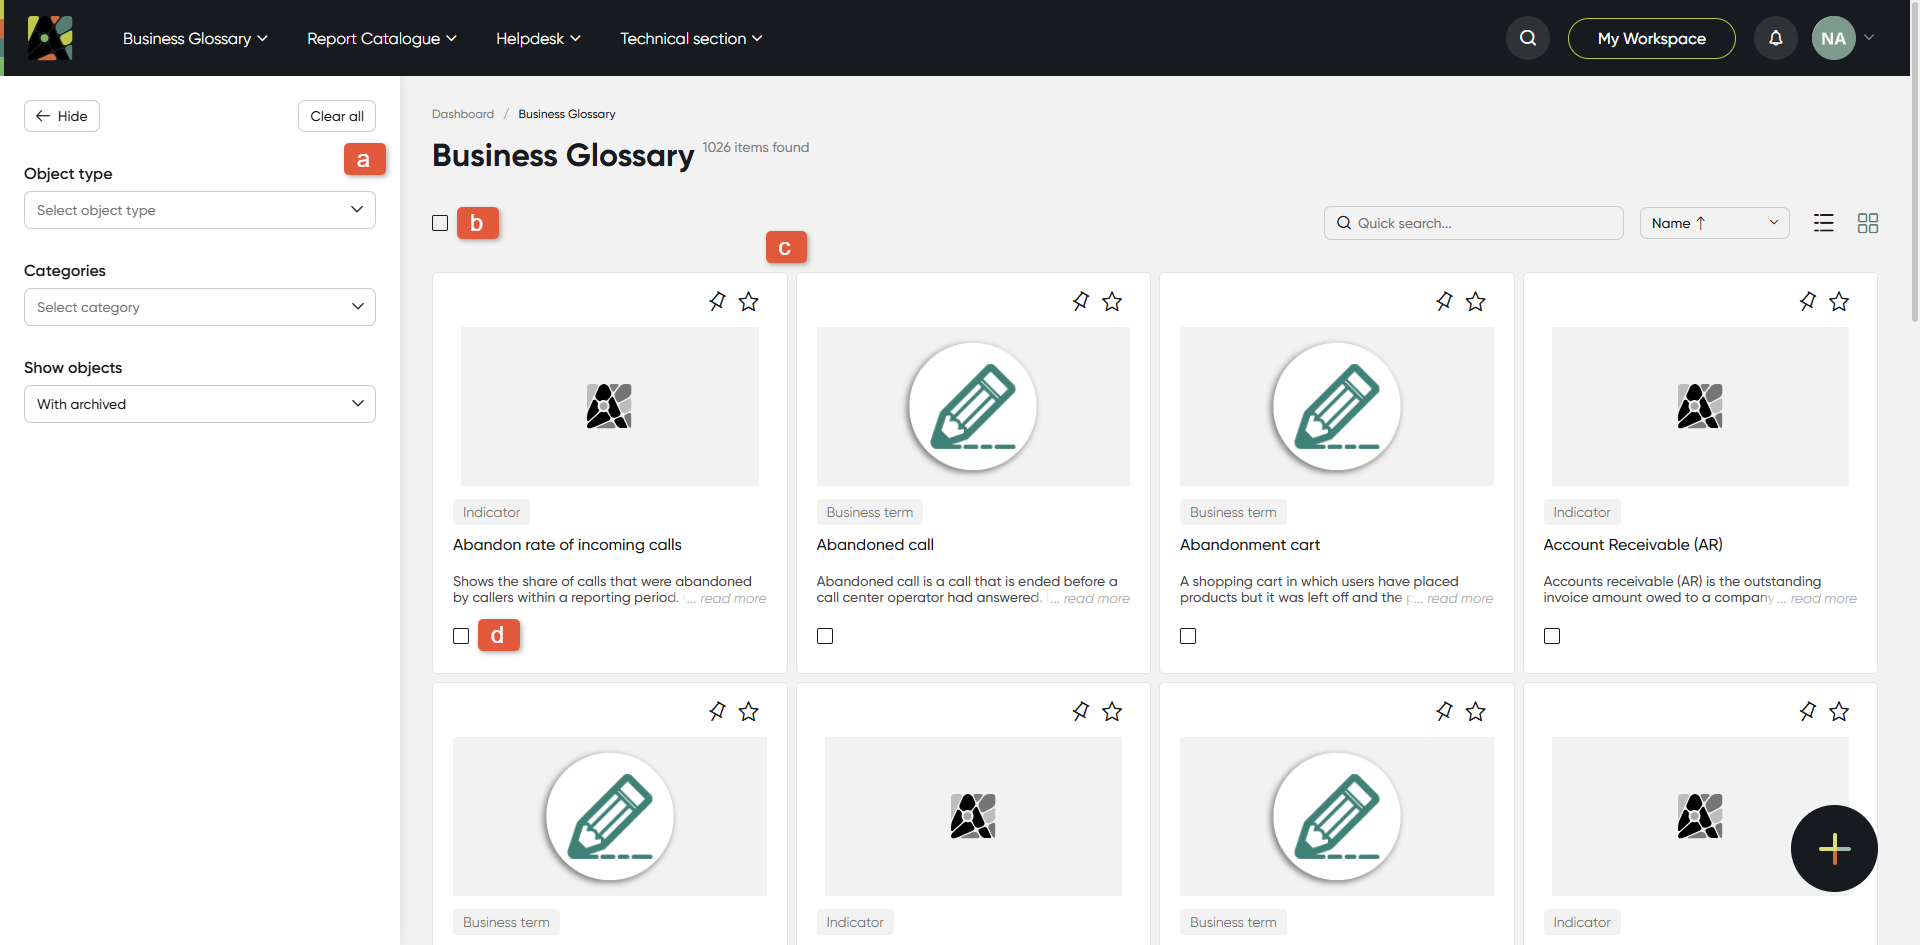
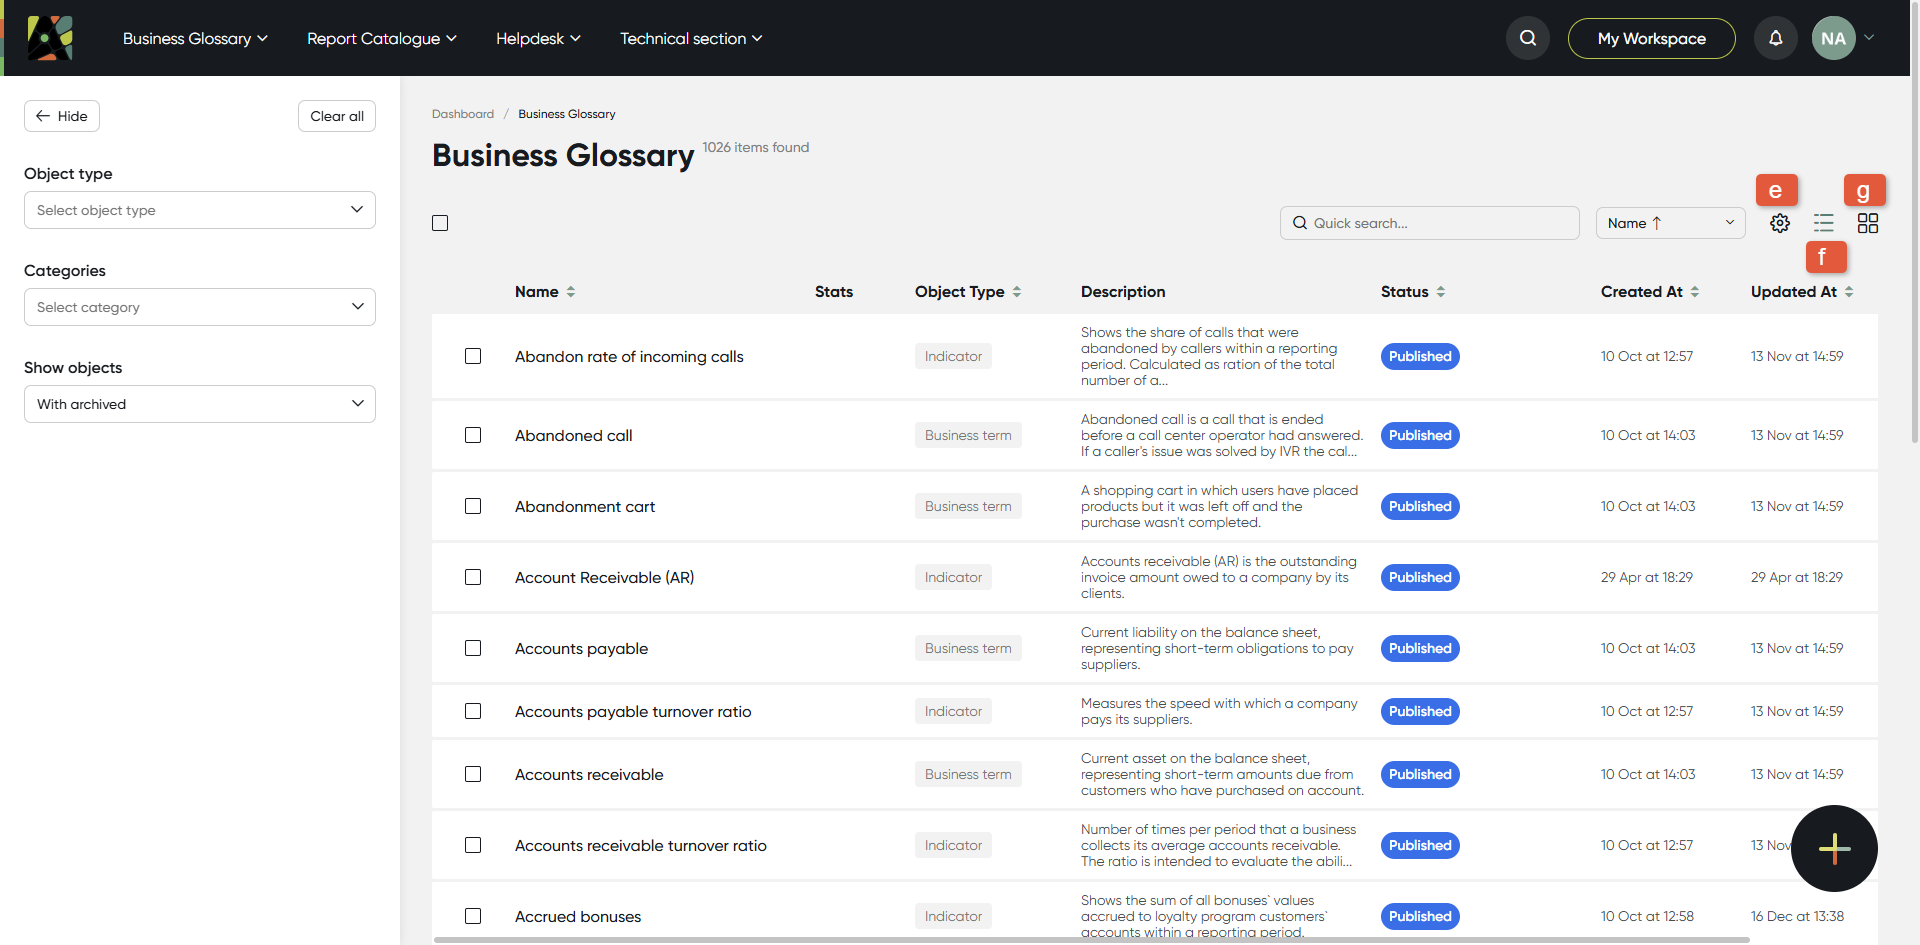
(e) list View Settings – customize the settings for displaying attributes, statuses and roles in the list view
(f) list View for Attributes – displays attributes in a list format
(g) card View for Attributes – displays attributes in a list format
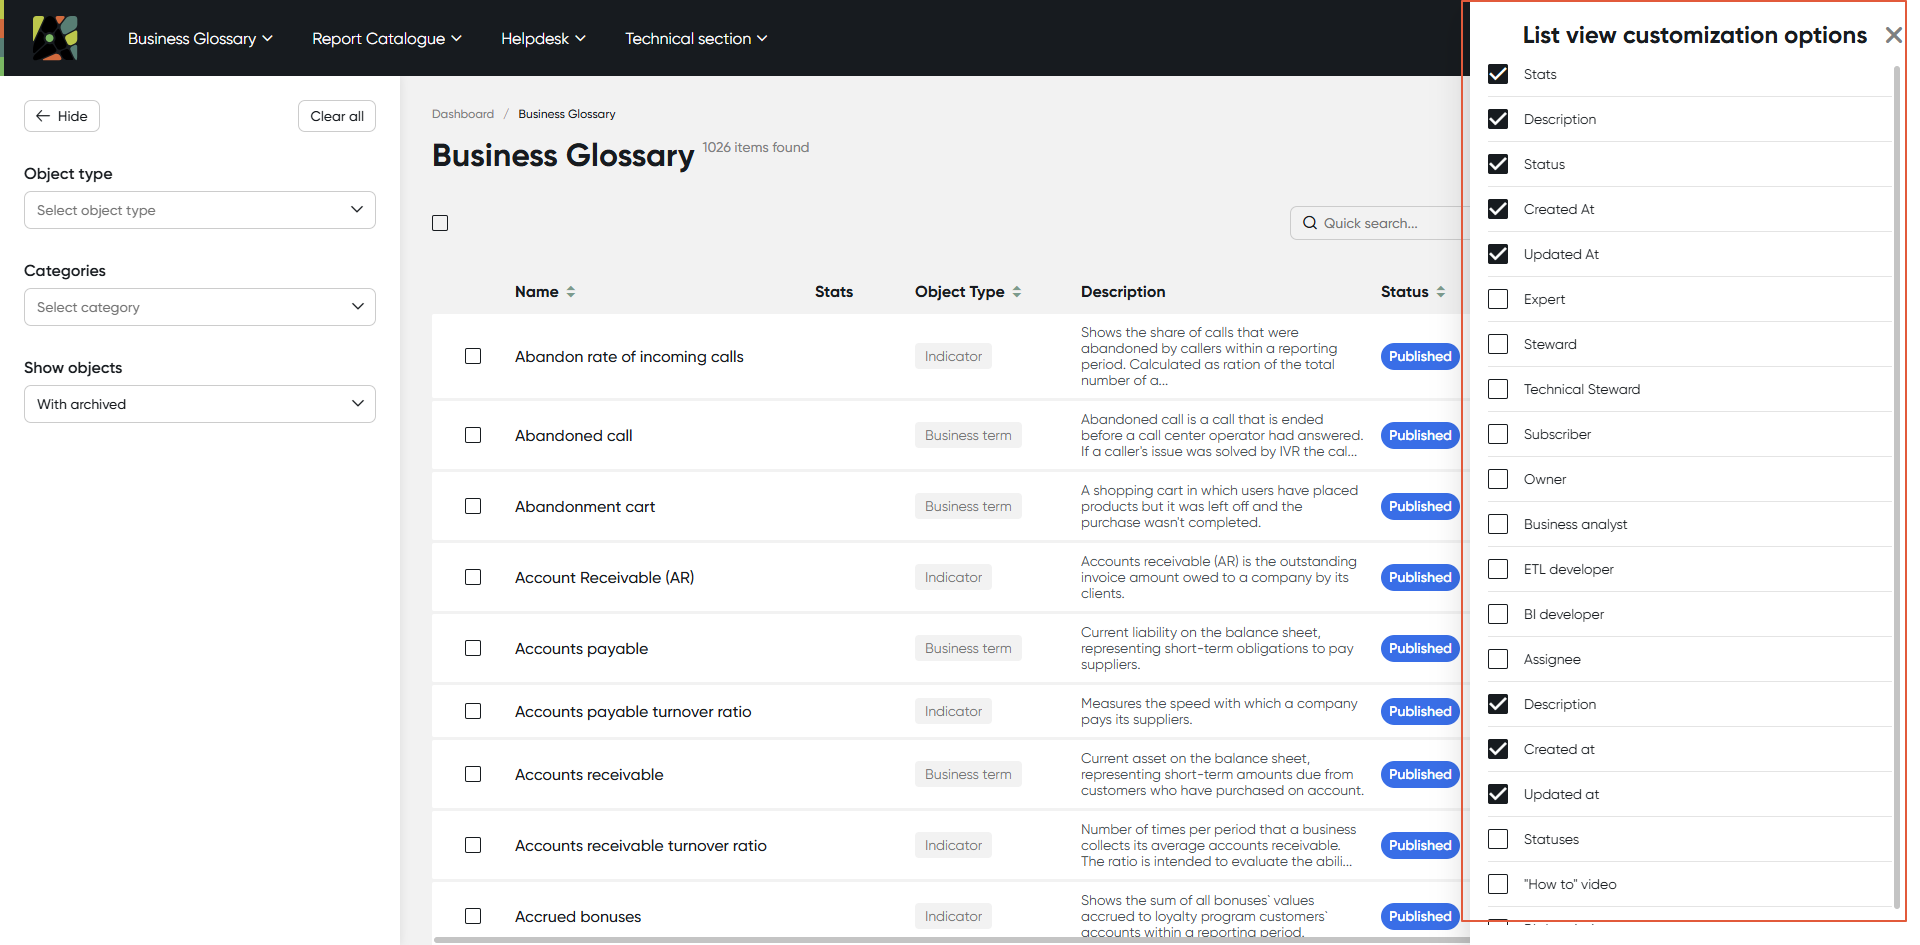
For more information about List View Settings, refer to the Table view attributes page.
Module 2. Report Catalogue
In the Report Catalogue module you can view the all reports and related objects (report pages, sections, etc.).
Each report card contains two icons that show:
- Number of views for the past 6 months
- Number of active users for the past 6 months
This data is based on our analysis of user interactions with reports using Analytics Hub.
You can find these details next to the Open button (a).
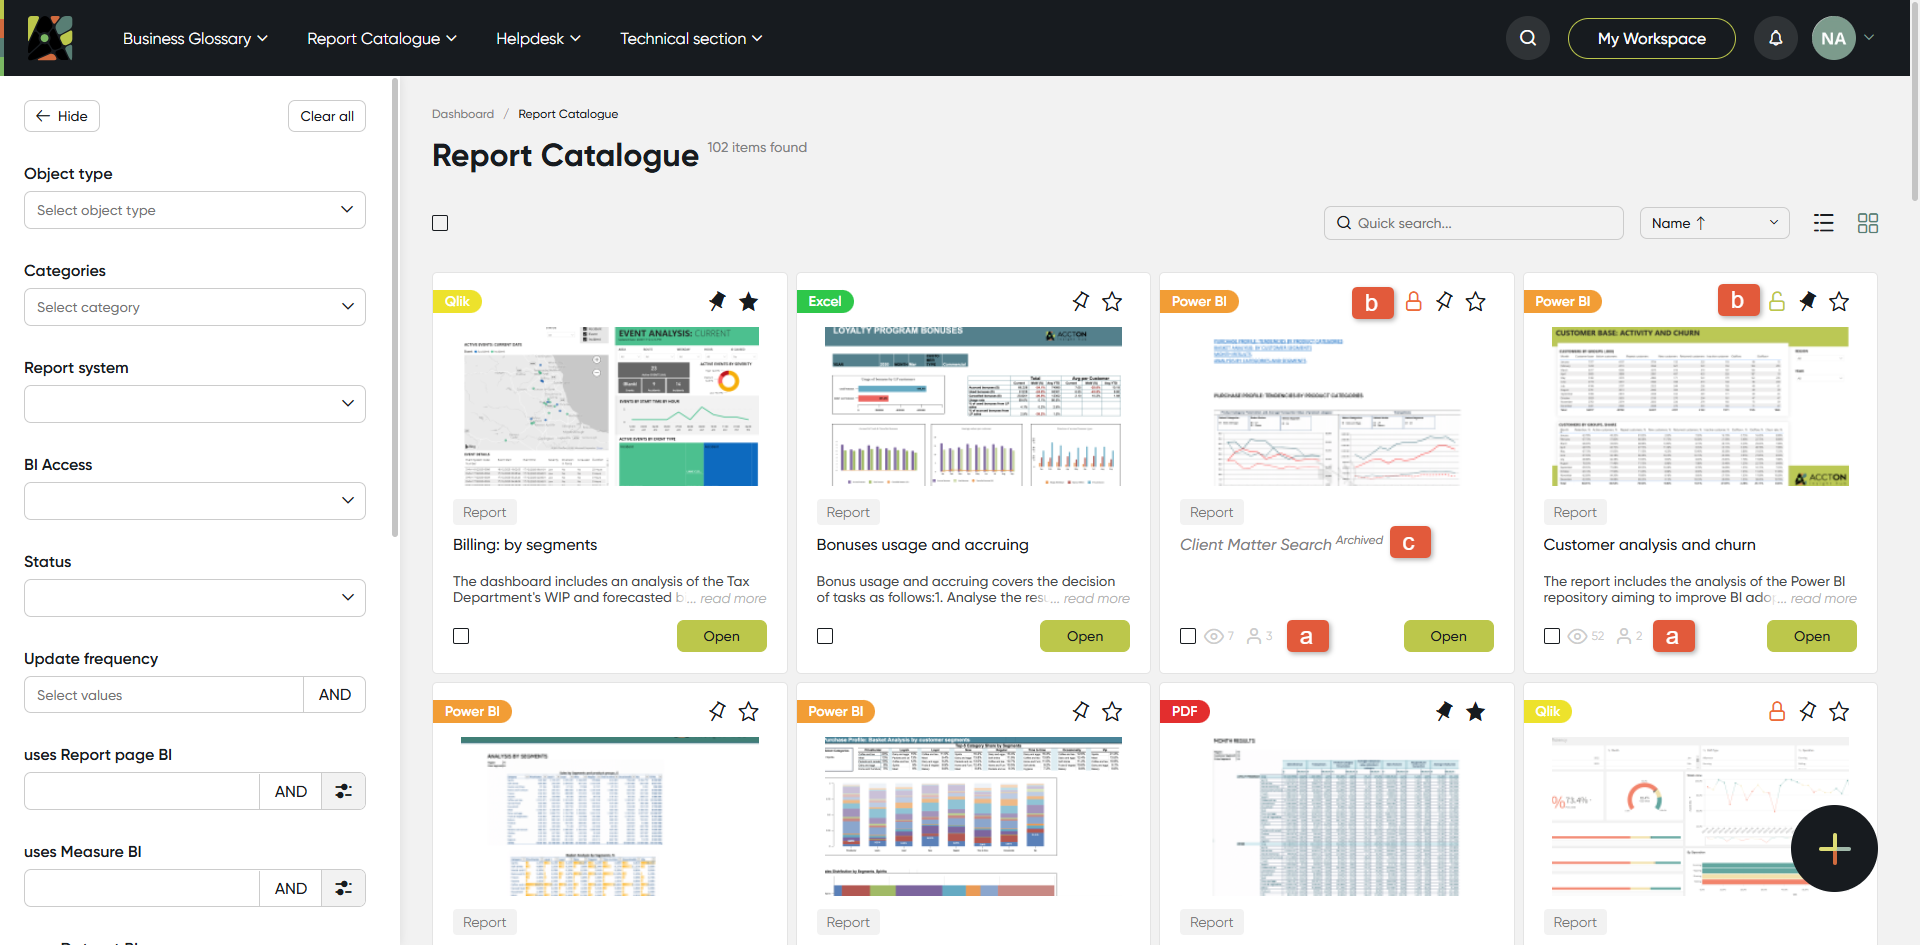
For objects imported from BI and users from Azure AD, existing permissions are imported as well. This is why a lock icon (b) appears next to the pin and star buttons. The icon is either green or red, indicating your access level. You can use the BI Access filter to view only available reports.
Please note For objects imported from BI and users from Azure AD, existing permissions are also imported. As a result, a lock icon appears next to the pin and star buttons to indicate access levels:
- A green lock icon means the user has access to the report.
- A red lock icon means the user does not have access to the report.
Restrictions apply only to the report itself, which can be accessed using the Open button. Additionally, you can use the BI Access filter to view only the reports you have access to.
You can see (c) archived objects - objects that have become unavailable or were deleted from BI.
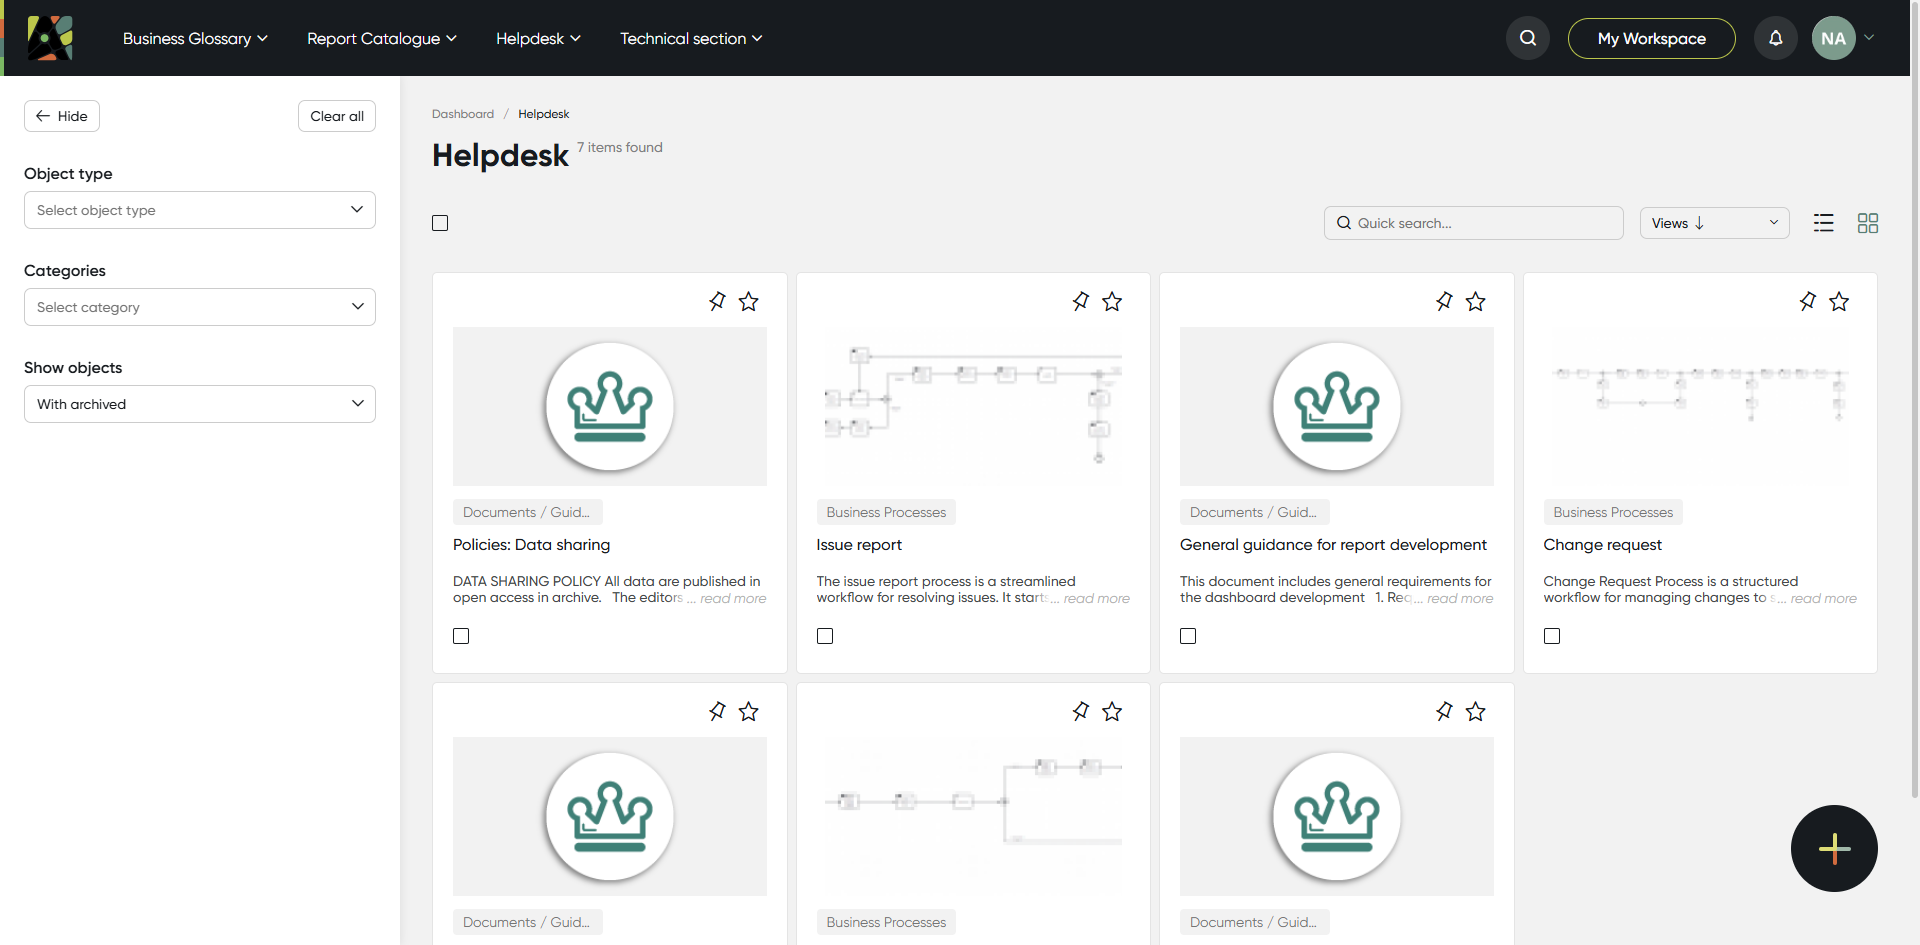
Module 3. Helpdesk
View the organisational domains of your company in the Organisational Domains module. Click on any department or division to check the information which is contained there.
Module 4. Technical Section
The Technical Section module provides access to all technical objects. Users can view, manage, and filter these objects, ensuring quick access to the relevant technical data.
Navigate through this section to find detailed information and perform necessary actions on technical objects.
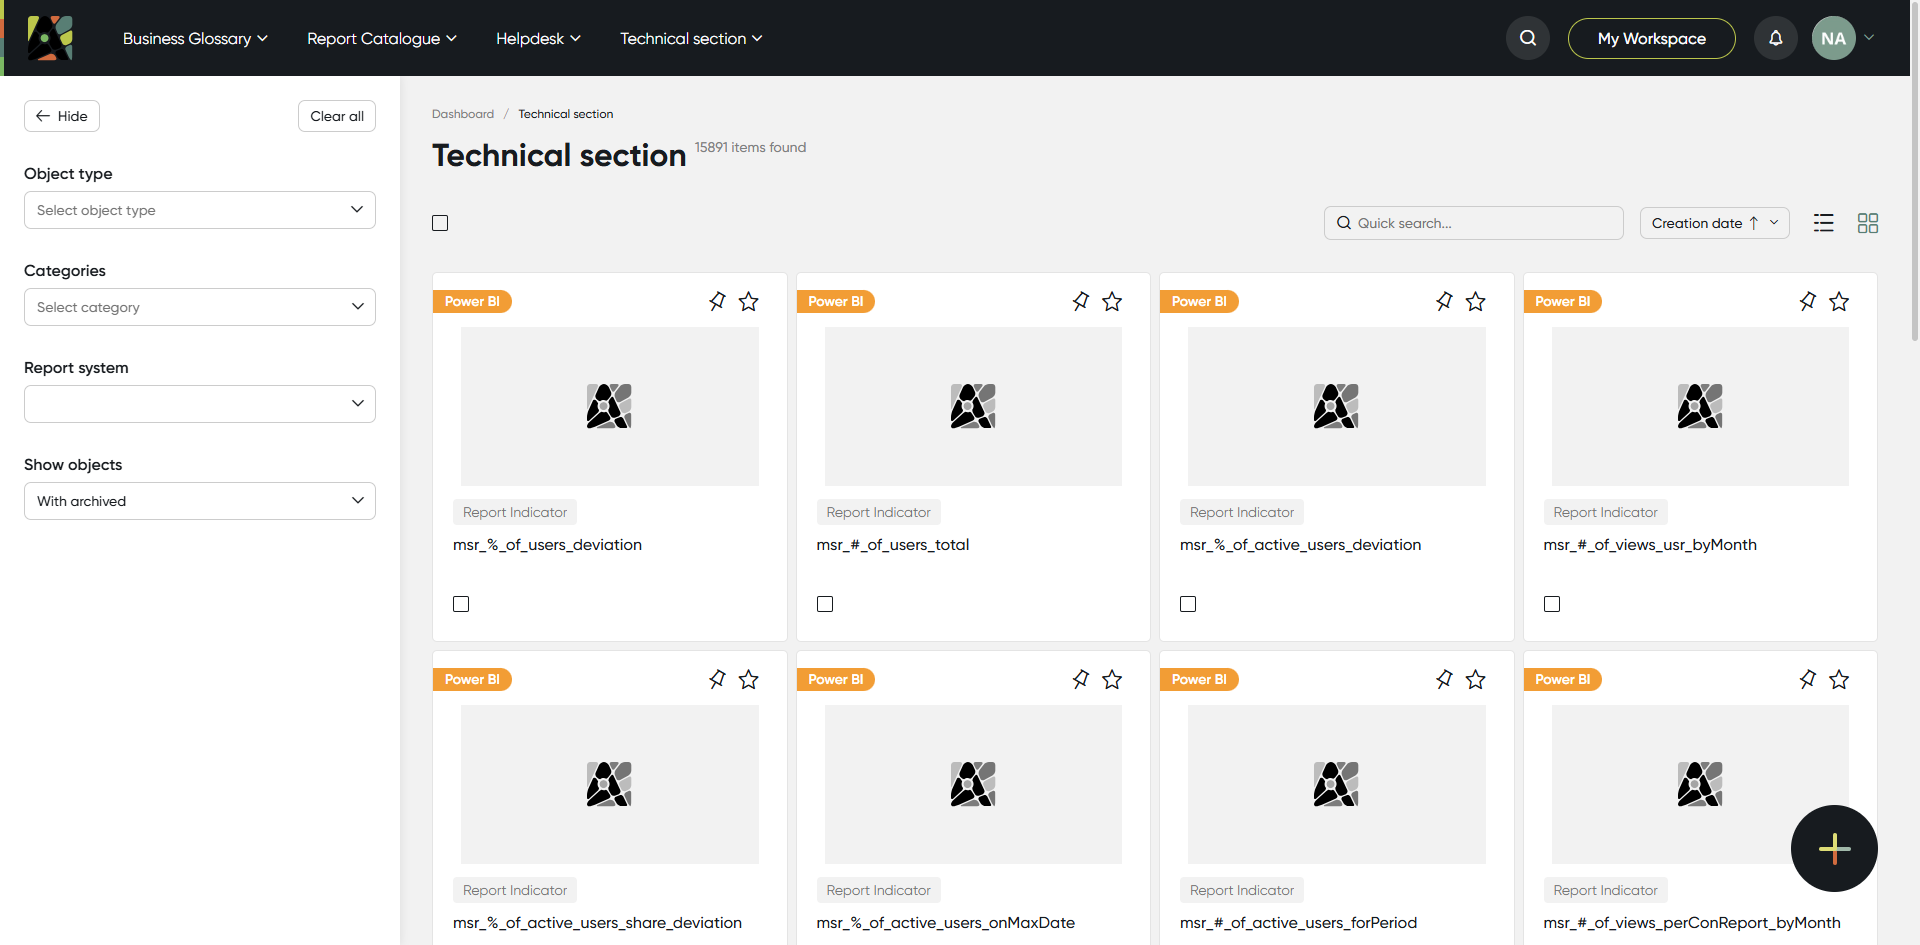
This module was created to enable the unloading of the previous three modules. It contains all objects and their corresponding technical types.
For more information about Module settings, refer to the Modules page.
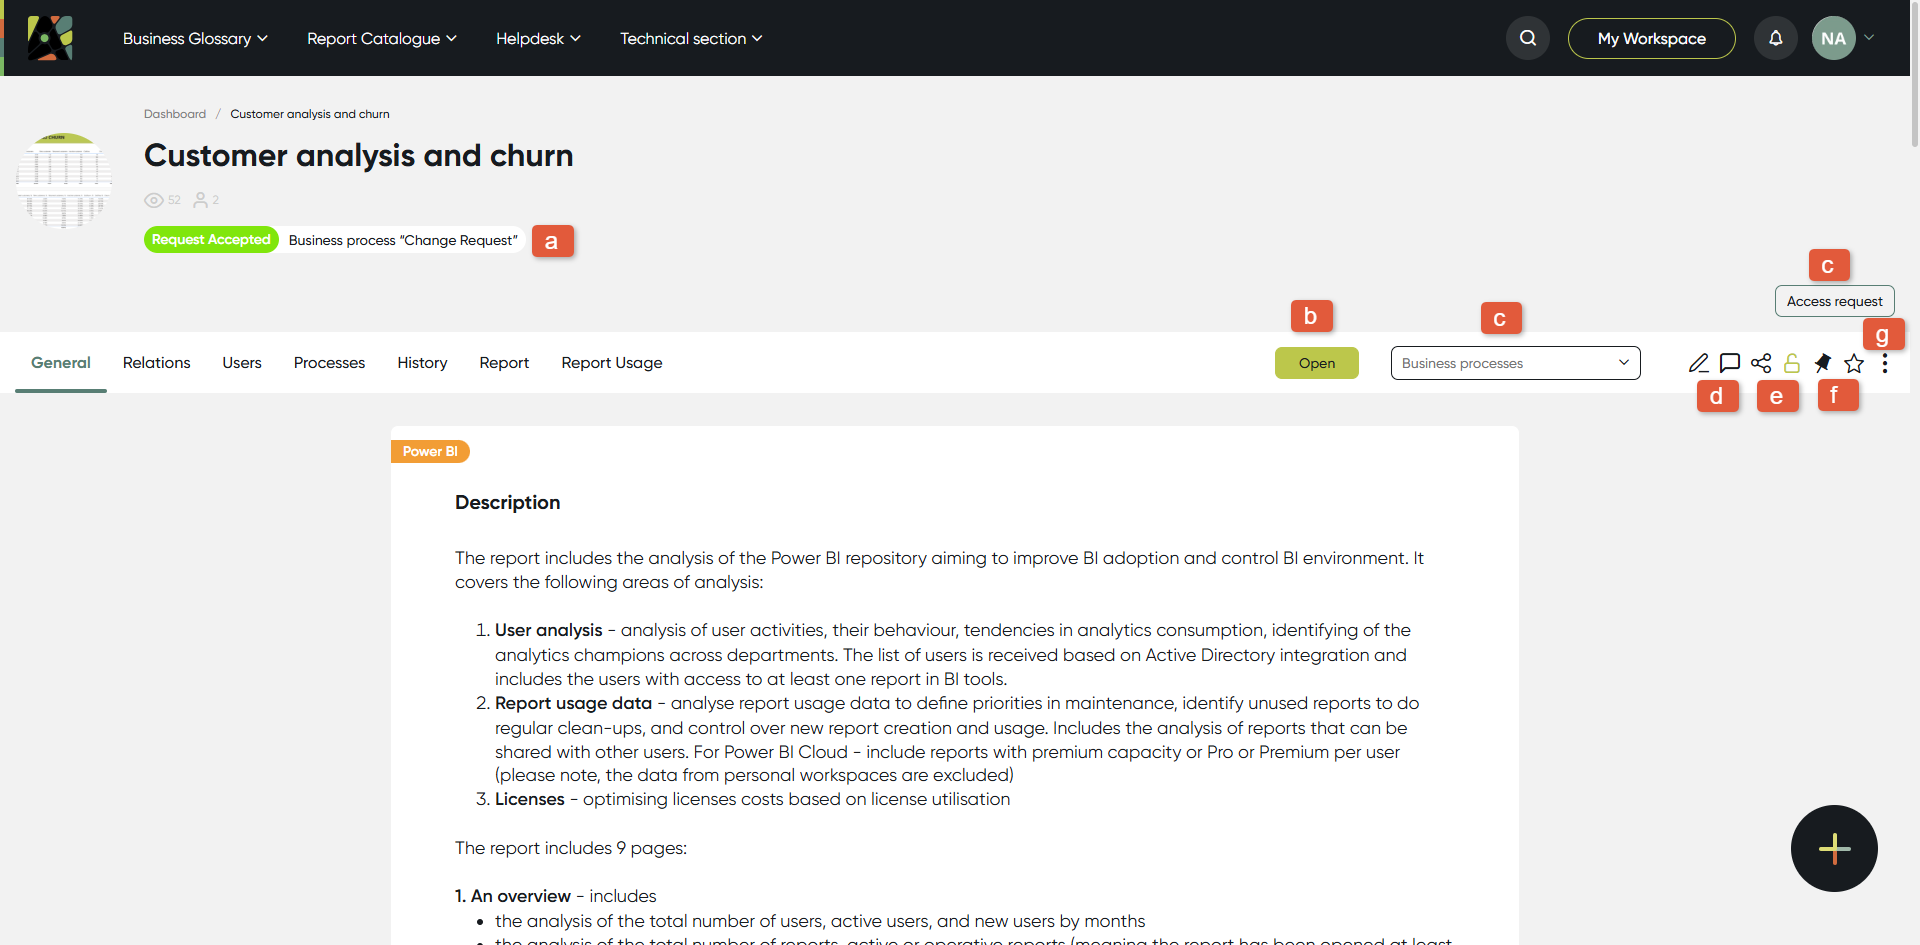
5. Object description
This section has 5 tabs:- General
General contains all object attributes, like definition, screenshots, links, calculation formula, etc.
Every object in turn has its own set of attributes.
Click on any object from any page to check object description.
(a) The Status indicator shows the current status of the report within the business process.
When you hover over it, it reveals:
- Business process
- Stage
- Started at
(b) - The Open button - opens the report link in a new browser tab and displays it in full-screen mode.
(c) The Business Process Launch allows users to start predefined processes.
The launch option can be configured by the administrator and displayed as:
- Dropdown menu – shows a list of available processes
- Button – starts a specific process directly
Both options can be used simultaneously, for more information, refer to the Business Processes page.
(d) The Edit Mode - opens the object editing page, where you can modify object information. See Edit Objects.
(d) The Chat button opens a chat window with two sections:
-
Messages: where you can chat
-
Notifications: where you can access all process requests that require your attention
(e) The Share button - allows you to share an object with another Accton user.
(e) The Lock icon - appears next to the pin and star buttons to indicate access levels:
- A green lock icon means the user has access to the report.
- A red lock icon means the user does not have access to the report.
(f) Pin and Star buttons.
-
Pin - allows you to add a report to the Pinned tab on the Home page for quick access.
-
Star - allows you to add objects to the My Workspace.
(g) The More button - provides additional options and functionalities relevant to your current context. Clicking on it will reveal a dropdown menu with the following actions:
- Export to: XLSX
- Export to: PDF
- Copy
- Absorb
- Move
- Edit
- Delete
- Share
- Generate description
- Clear from import
- Generate process link
Please note: All deleted objects are sent to the Bin, which is managed by the Admin.
"Generate description" button helps generate an AI-based description for the report. Admin can assign a specific attribute to be used for this purpose instead of the standard Description field.
"Clear from import" button helps remove information that was added to the object through absorption from the report. Please note: if the report was imported entirely, this action will delete it.
"Share" button in the object's context menu allows users to select another user in the system and share the object's card with them.
"Generate process link" button allows users to select a specific business process and generate a direct link that opens the portal with the selected process ready to be started.
(f) Direct Attribute Link
Allows copying a direct link to any attribute on the General tab.
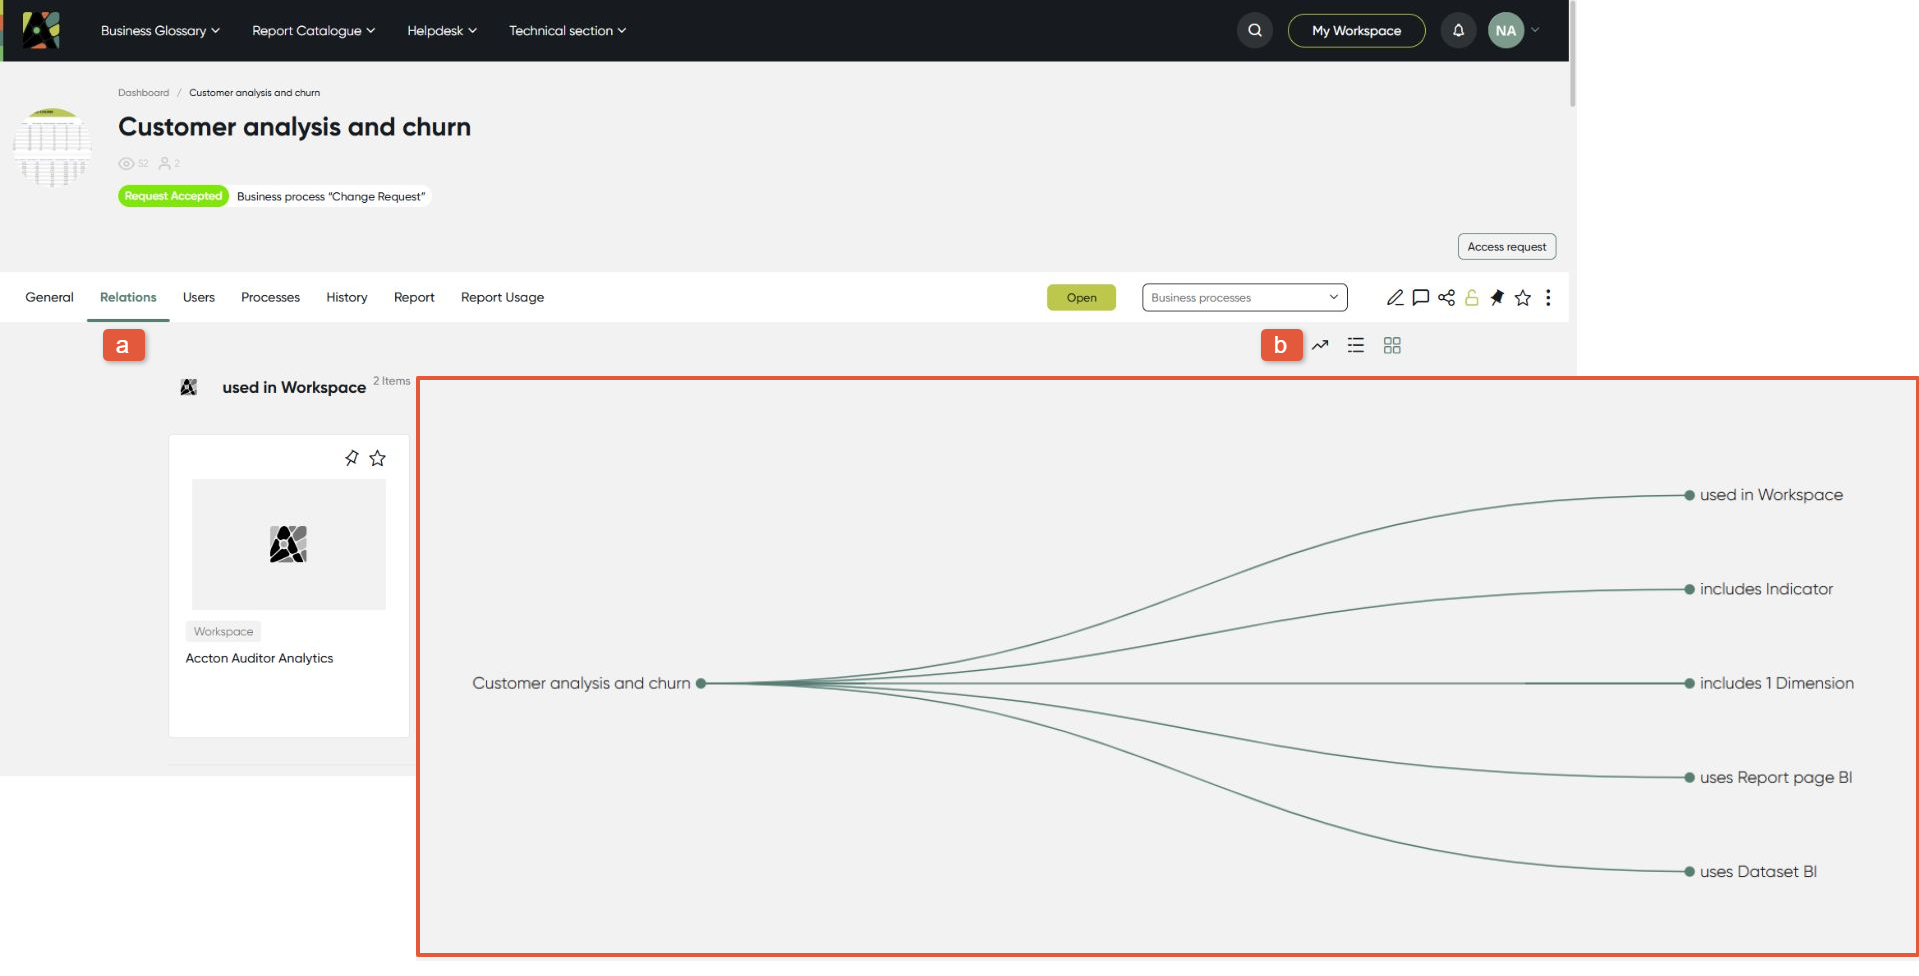
- Relations
Relations (a) – here you can find all related objects, like indicators included in reports, dimensions, filters. Click button (b) to switch to the diagram view.
For more information, refer to the Relations page.
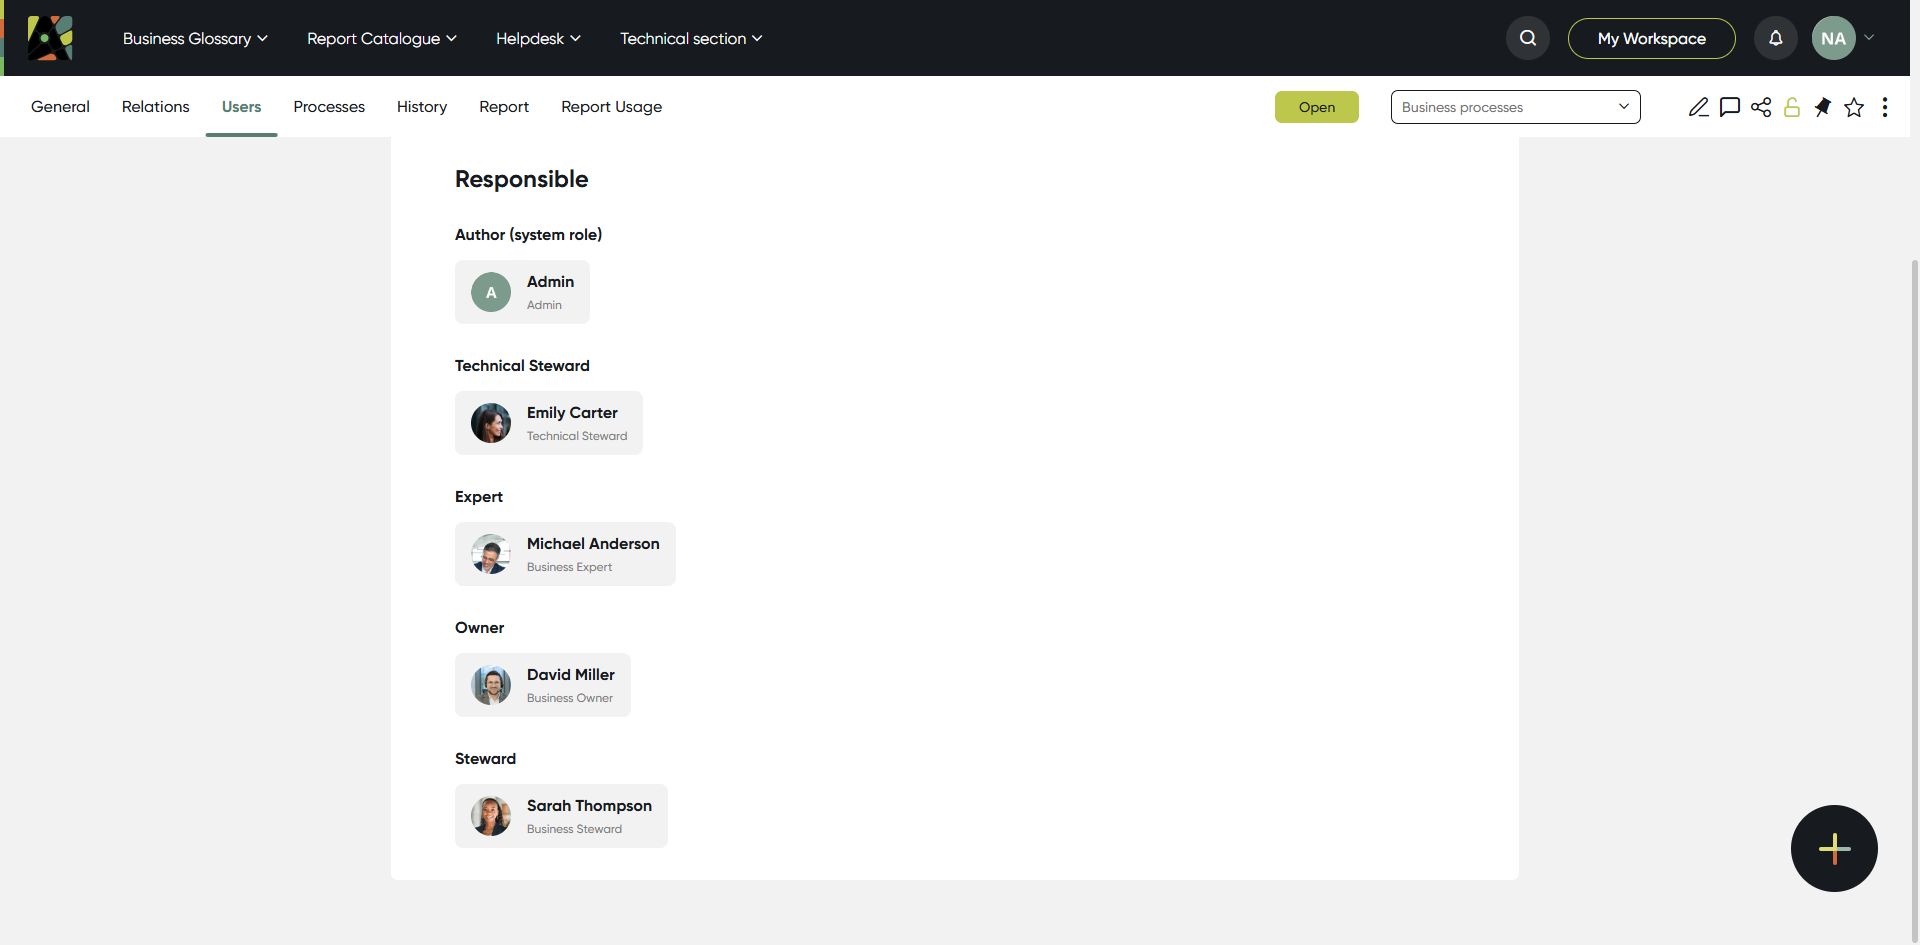
- Responsibilities
Responsibilities – check who is responsible for specific aspects of the object via this tab. There are four predefined roles: Owner, Expert, Steward, and Technical Steward.
For more detailed information, please refer to the Responsibilities page.
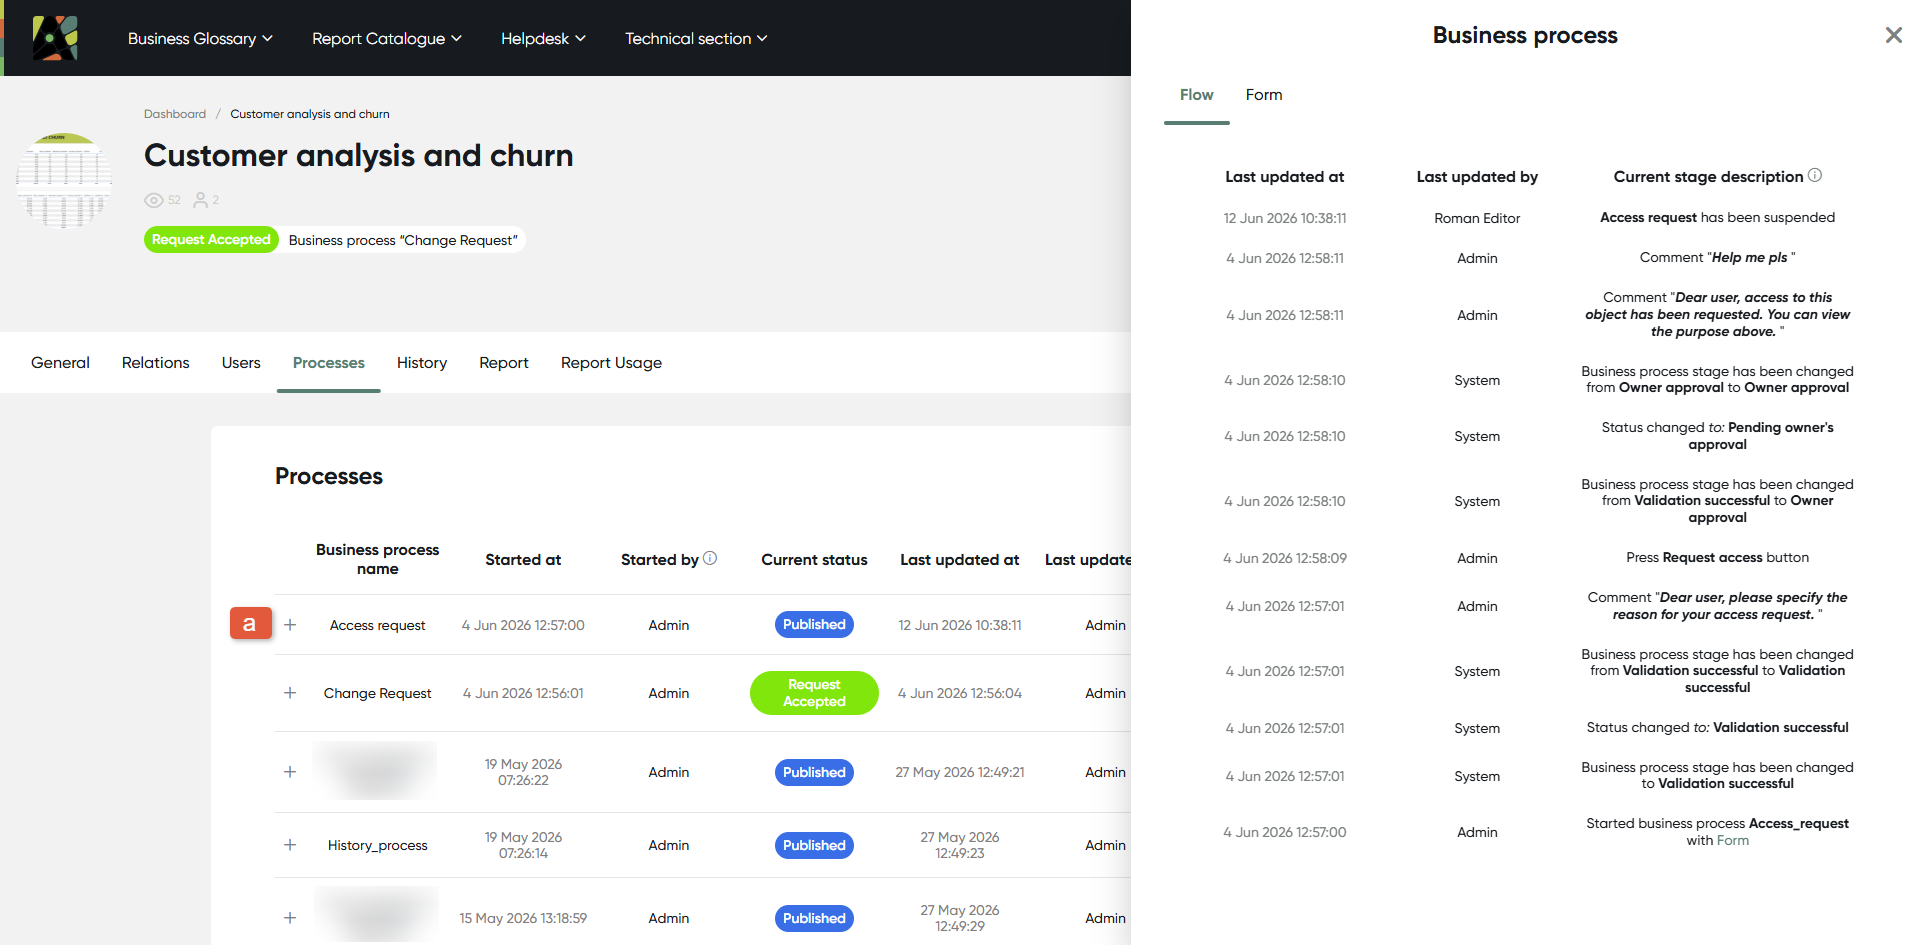
- Processes
Processes - here you can find all the information about processes related to the object. Click button '+' to see details.
For more information, refer to the Processes page.
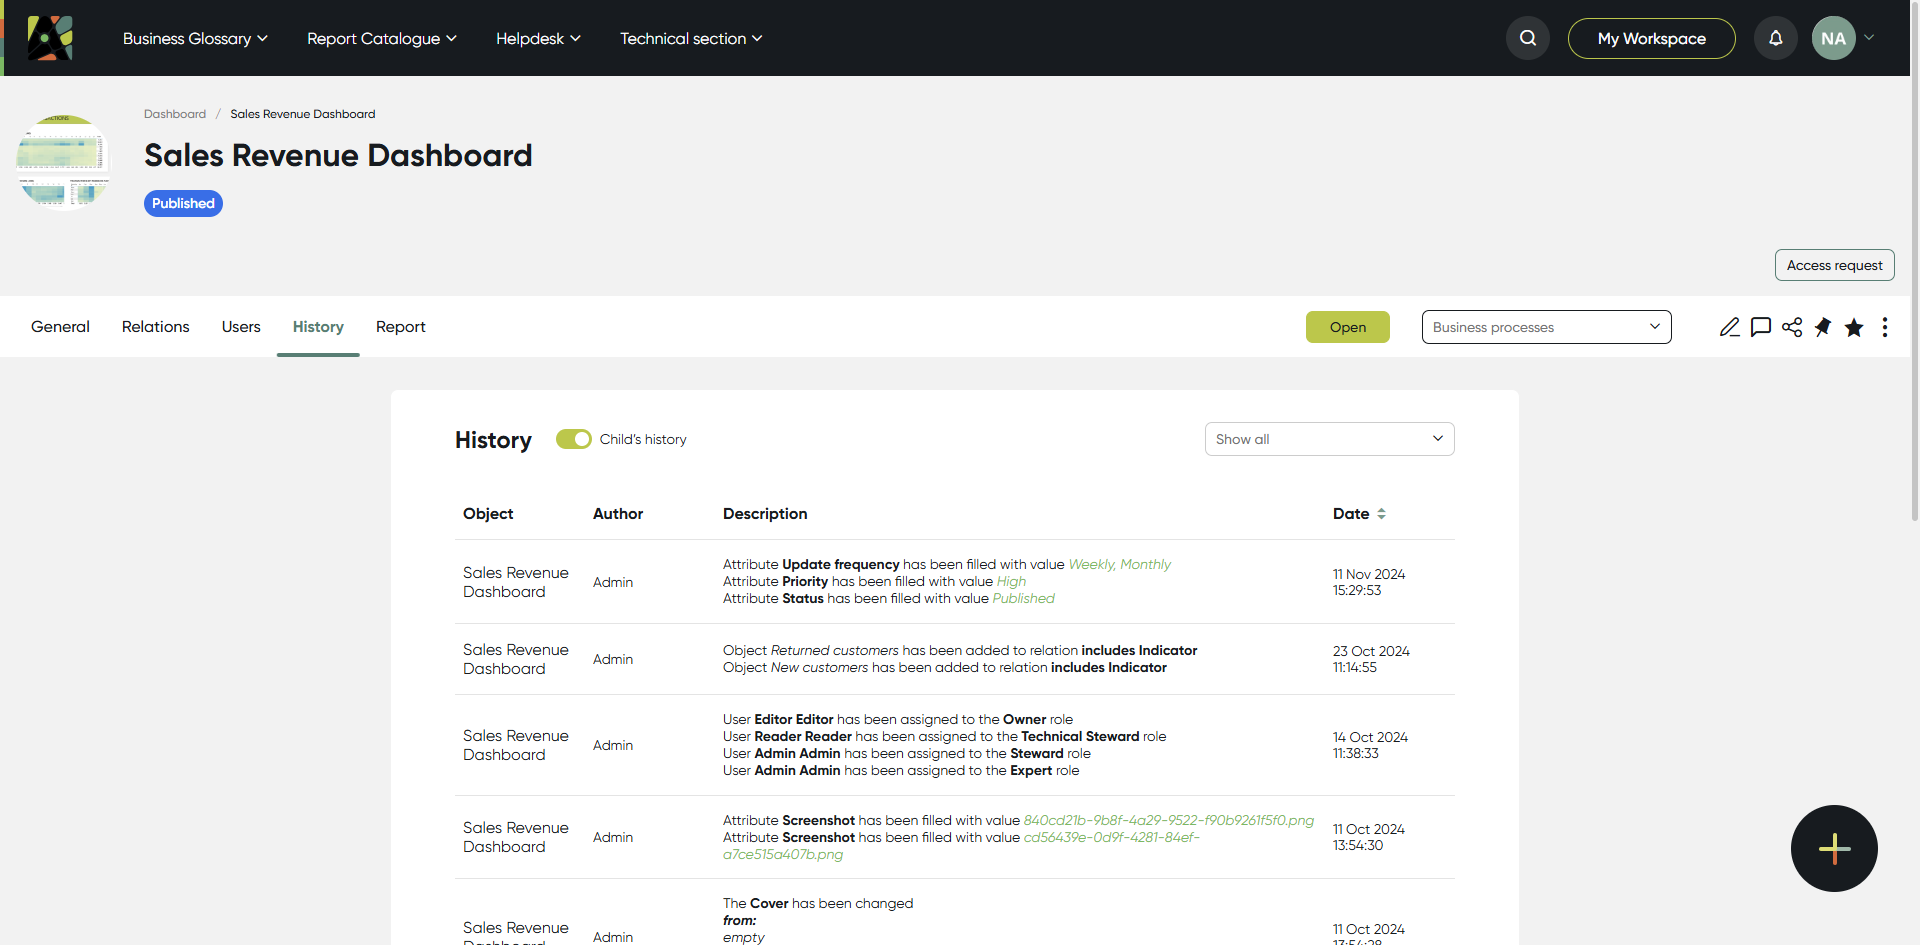
- History
The History tab offers insights into:
- Creation date and time
- Direct modifications to the object
- Timestamps of changes
- Individuals responsible for changes
- Chat messages related to the object
- Changes in related child hierarchical objects
- Previous and new values
For more detailed information, please refer to the History page.
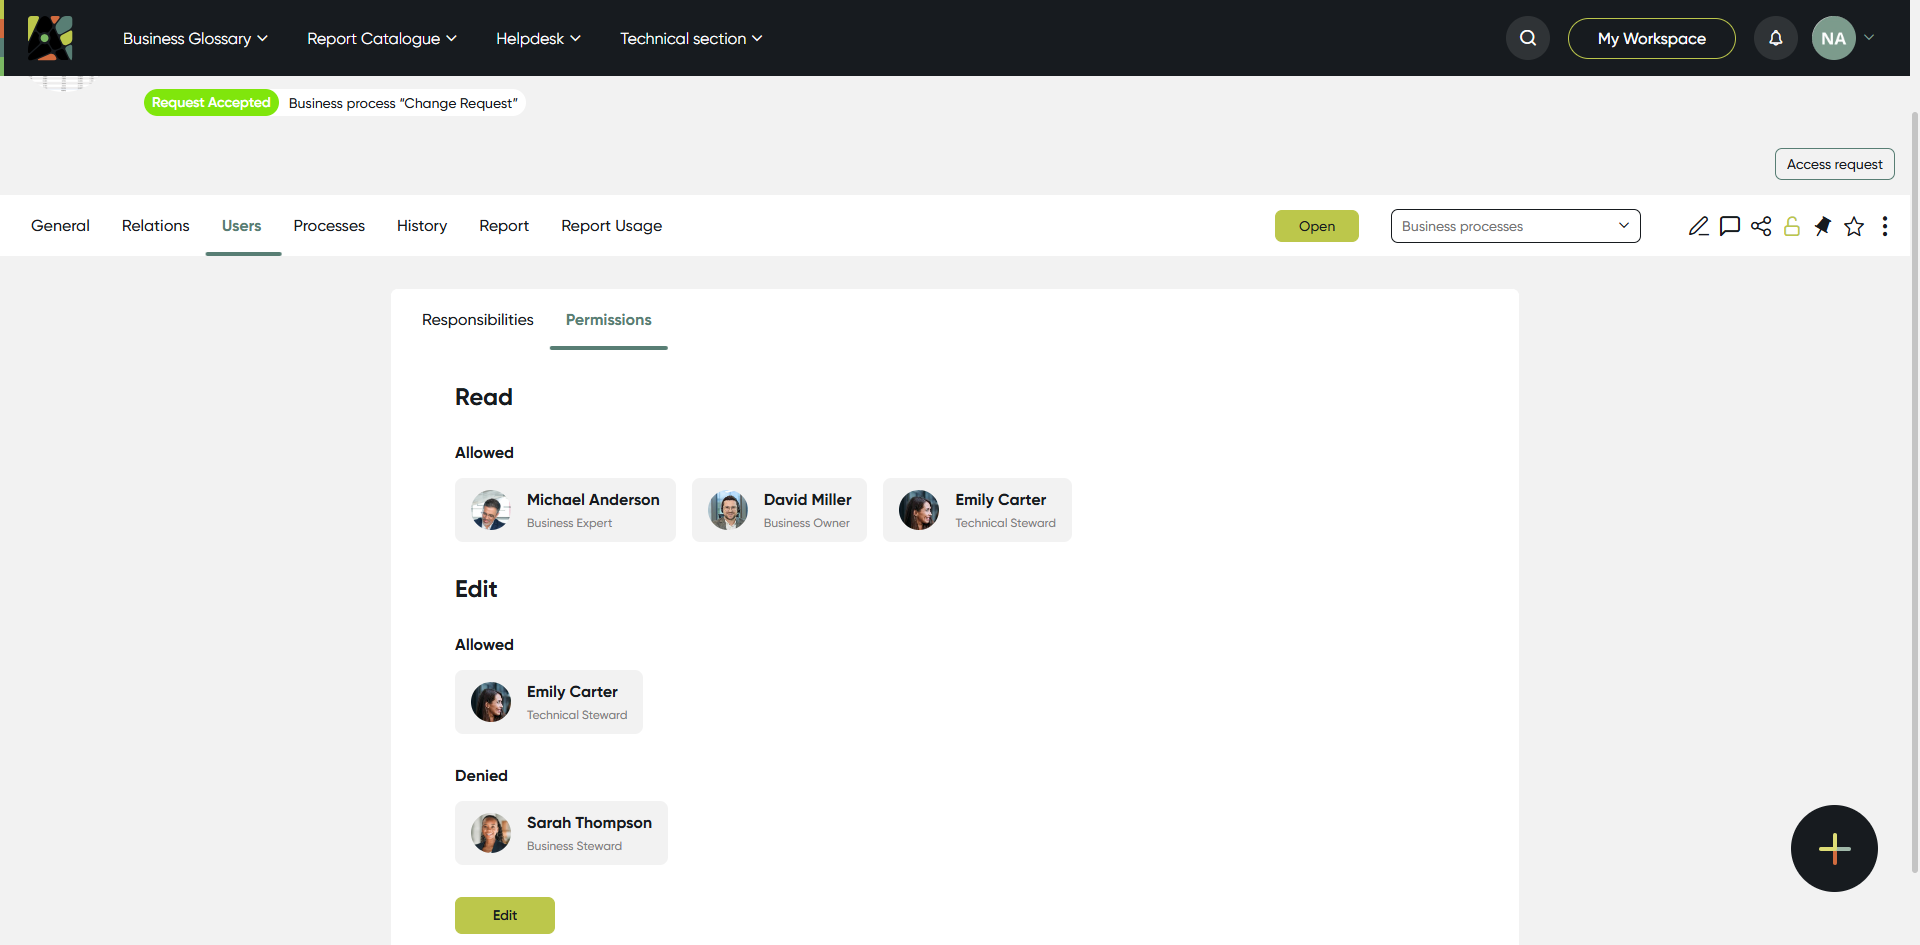
- Permission
The Permission tab allows to manage access rights and permissions for users and groups.
In the Admin Panel, you can control who can read, edit the report.
For more detailed information, please refer to the Permissions page.
- Report
The Report tab is where you'll find the in-built report if you have enabled "Frame View" for the reporting system.
Example of the 'Frame View' (disabled) in a report:
Example of the 'Frame View' (enabled) in a report:
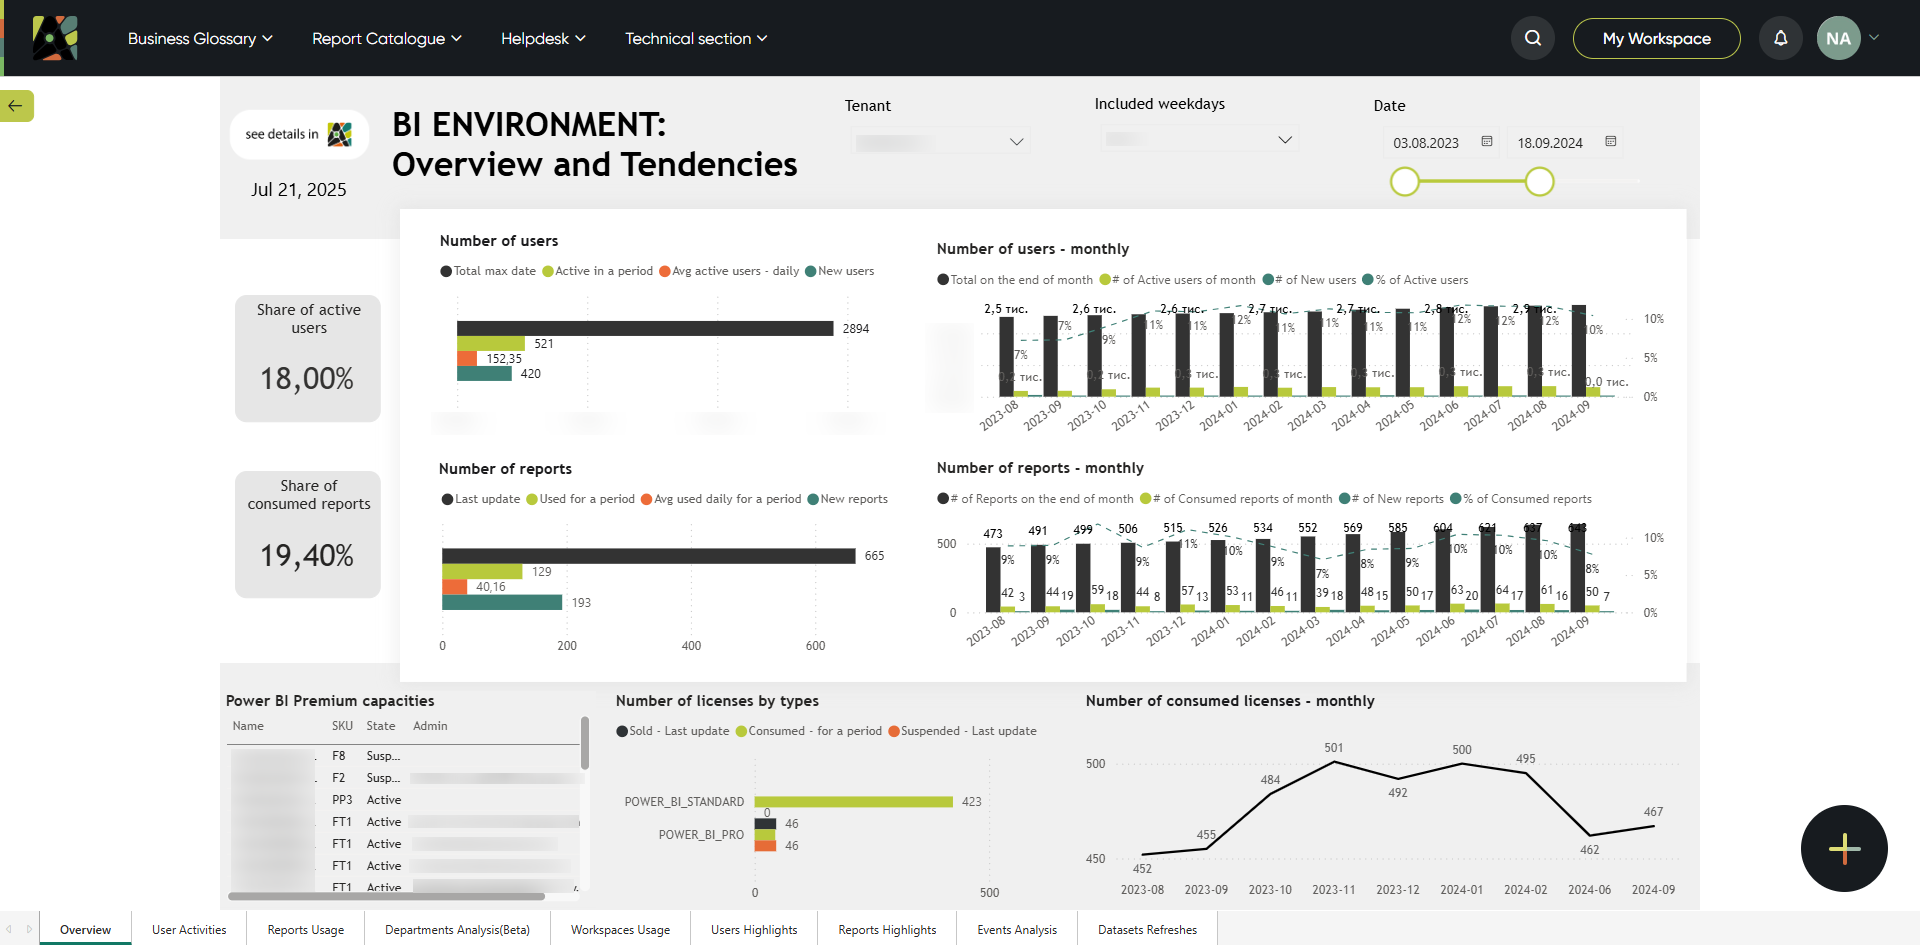
For more detailed information, please refer to the Report page.
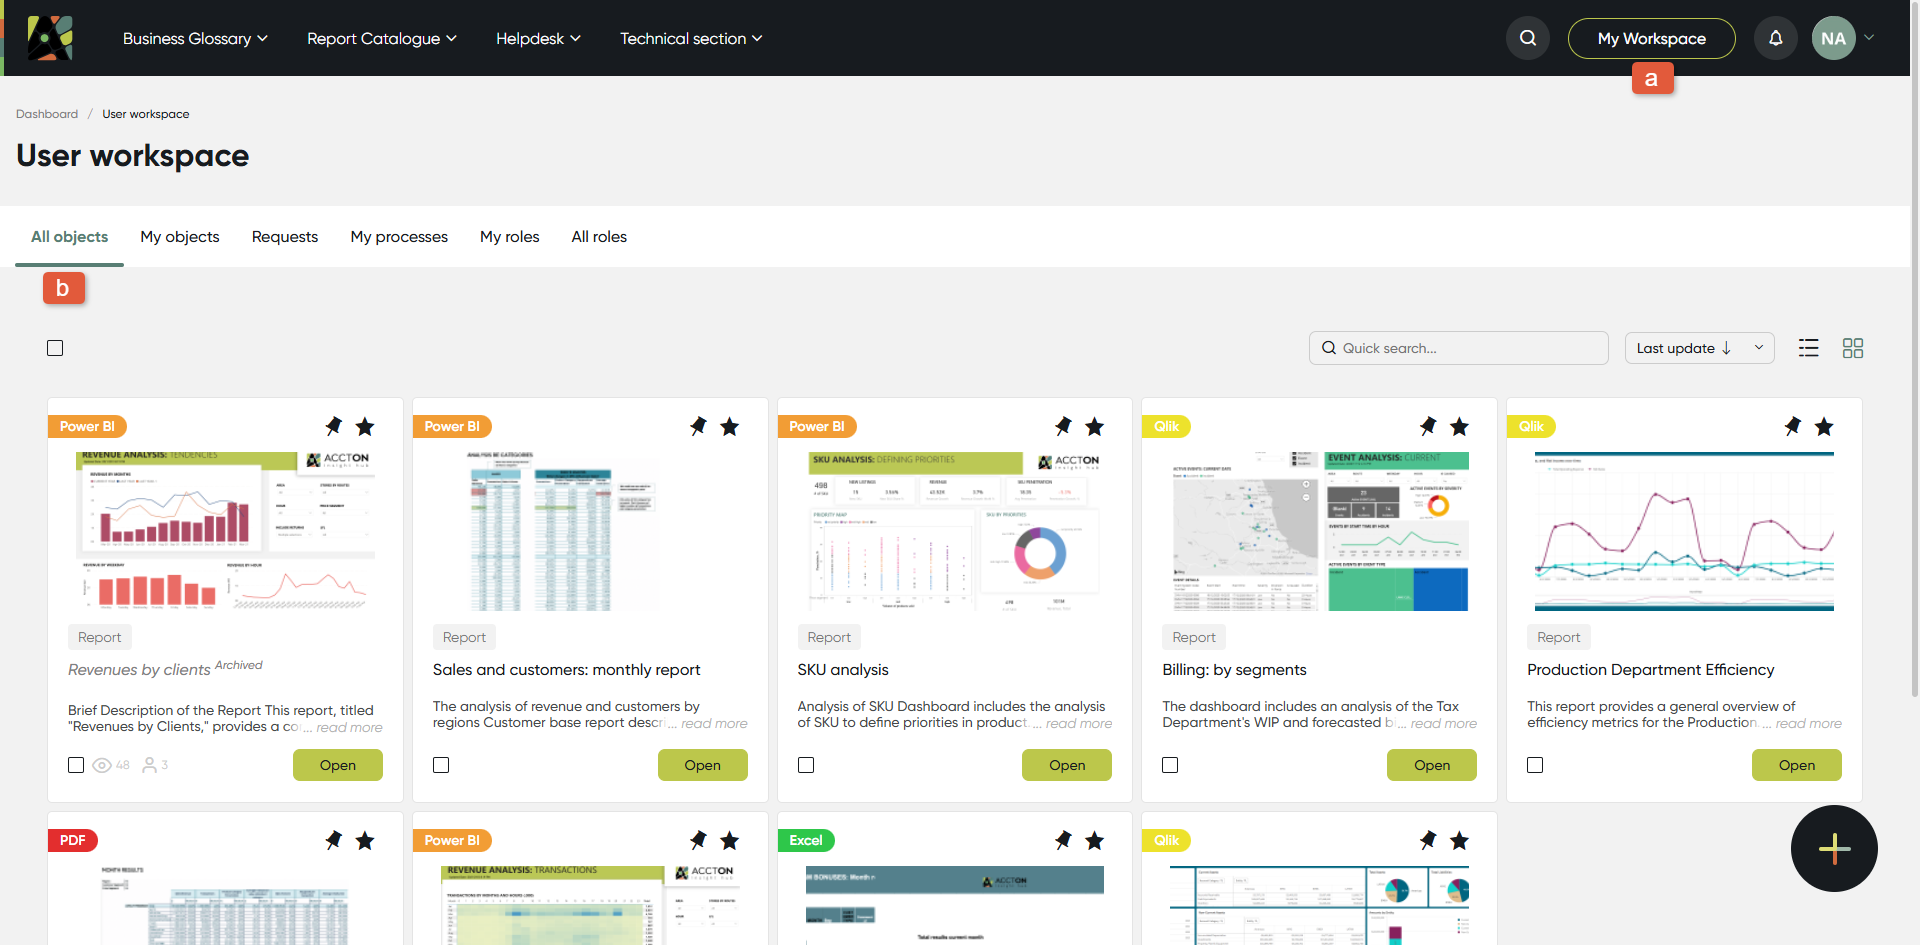
6. My Workspace
Open your Workspace with the Button (a) on top of the screen
In the workspace store all objects you are using for ease of instant access: reports, KPIs, business terms, etc.
Click on each of the five tabs (b) to choose:
- All objects - contains all objects you've pinned using the 'Star' button
- My objects - automatically shows all objects and categories you've created. You can unpin them from the workspace.
- Requests - cards of requests with recent activity
- My processes - you'll find processes information you're involved with
- My roles - shows objects where you have a role assigned, including role name, who granted it, and when. Object names are links to their pages.
- All roles - shows the same as My Roles, but includes all objects with all assigned roles. This option is available for admins only.
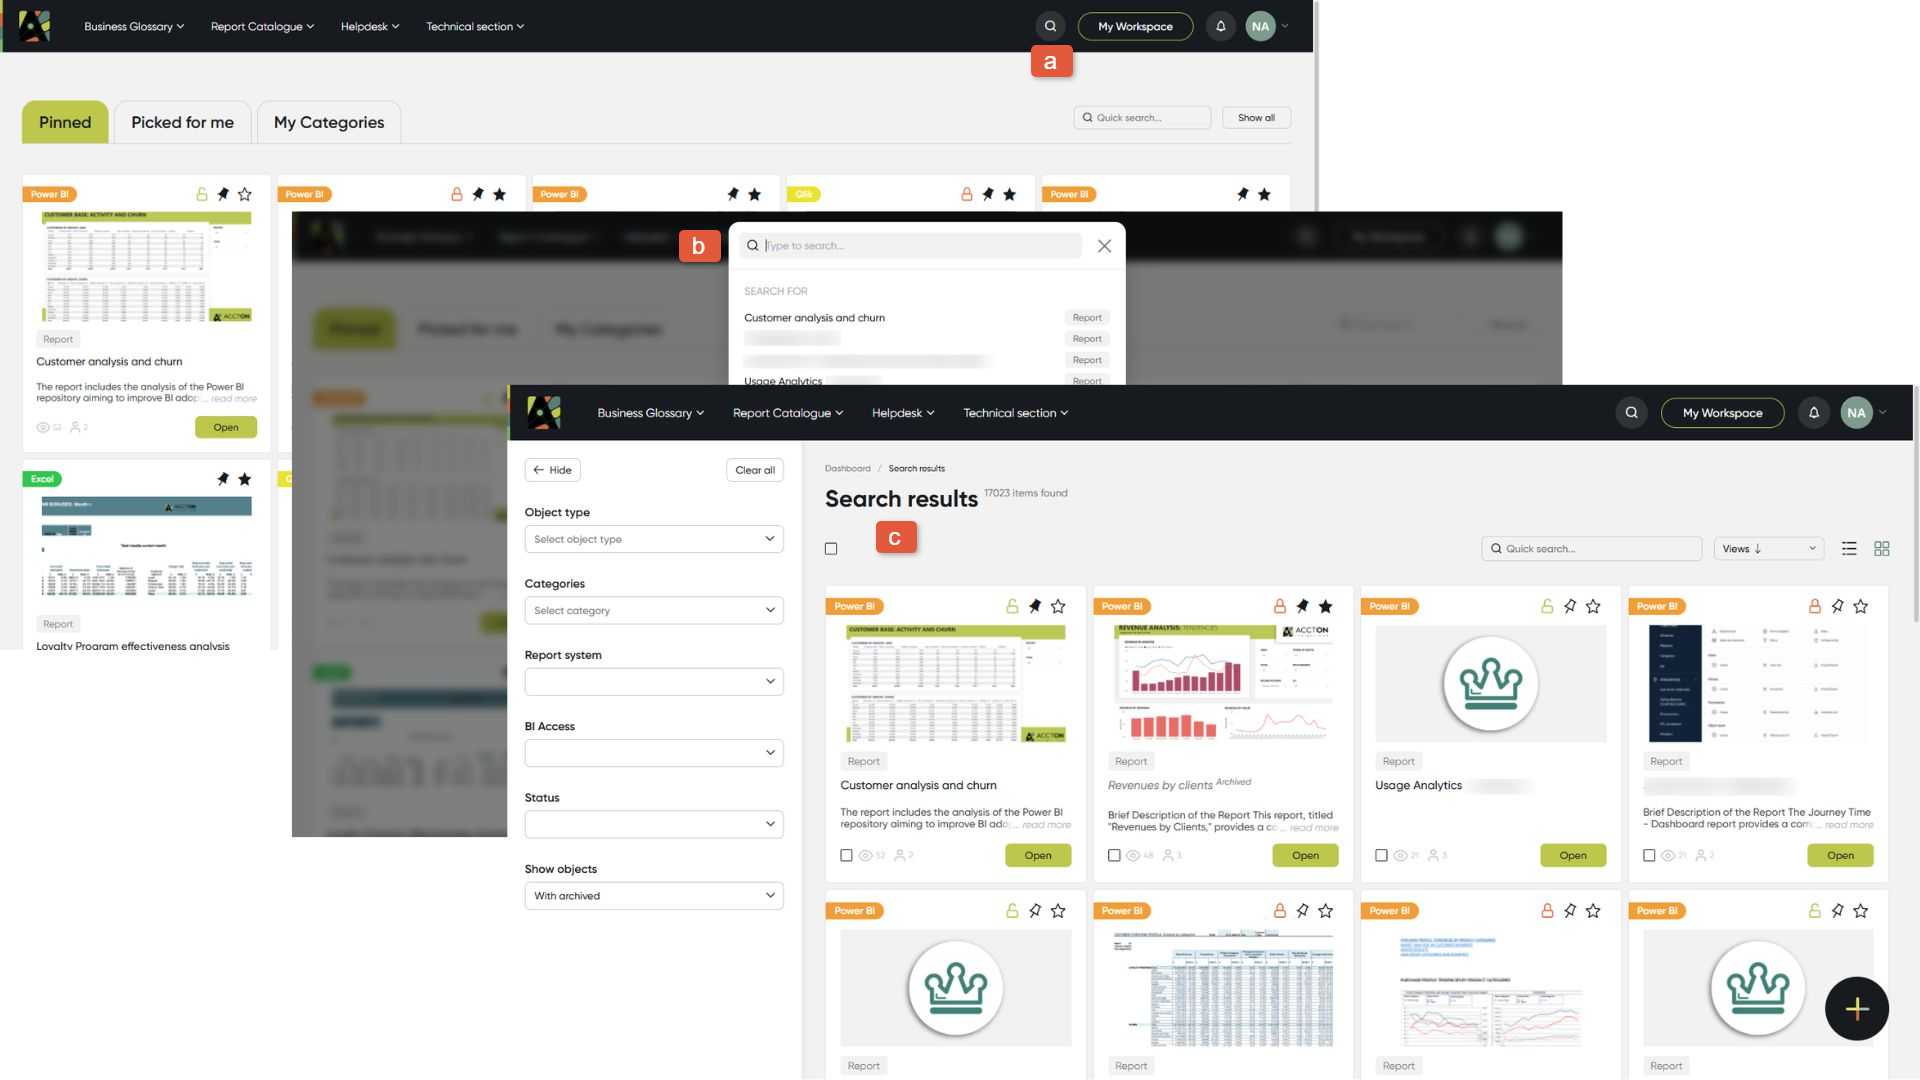
7. Search
Search for new information easily using Smart Search:
-
Click Search (a)
-
Type your query in the search field (b)
-
Use the filtering panel © to further narrow down the search results.
8. Report Usage
The Report Usage tab provides insights into how a specific report is used within the selected date range.
The tab includes:
-
Statistics
Overview of report activity, including -
Report folder,
-
Created date,
-
Created by,
-
Report status,
-
# of users with access,
-
# of report active users,
-
Share of active users,
-
# of report views,
-
# of views per active user,
-
Decommission date and Last view by any user.
-
Views & Dashboard Consumers Chart
Displays trends of report views and dashboard consumers over time, based on the selected date range. -
Details by Users Table
Lists individual user activity, including the number of views per user. Scroll appears if records exceed the visible area. -
General Permissions
Displays who has access to the report, including user details, assigned groups, and permission actions. Scroll appears if records exceed the visible area.
Additional Features
- Date filter – allows selecting a custom date range.
- ETL connector check – if not configured, a placeholder message is displayed: “To output data on the use of the report, configure the ETL connector.”
For more detailed information, see the Report Usage page.